MOOR INSTRUMENTS moorLDI2 RESEARCH USER MANUAL
96
This feature can be useful for observing more clearly responses to a stimulus by subtracting a
baseline image from all other images.
Enter the number of the image to be subtracted. You can also choose to average the first several
repeat images then use this averaged image as the base image for subtraction or select a single image
file. Note that this single image must have the same number of pixels and the same aspect as that of
the repeat image.
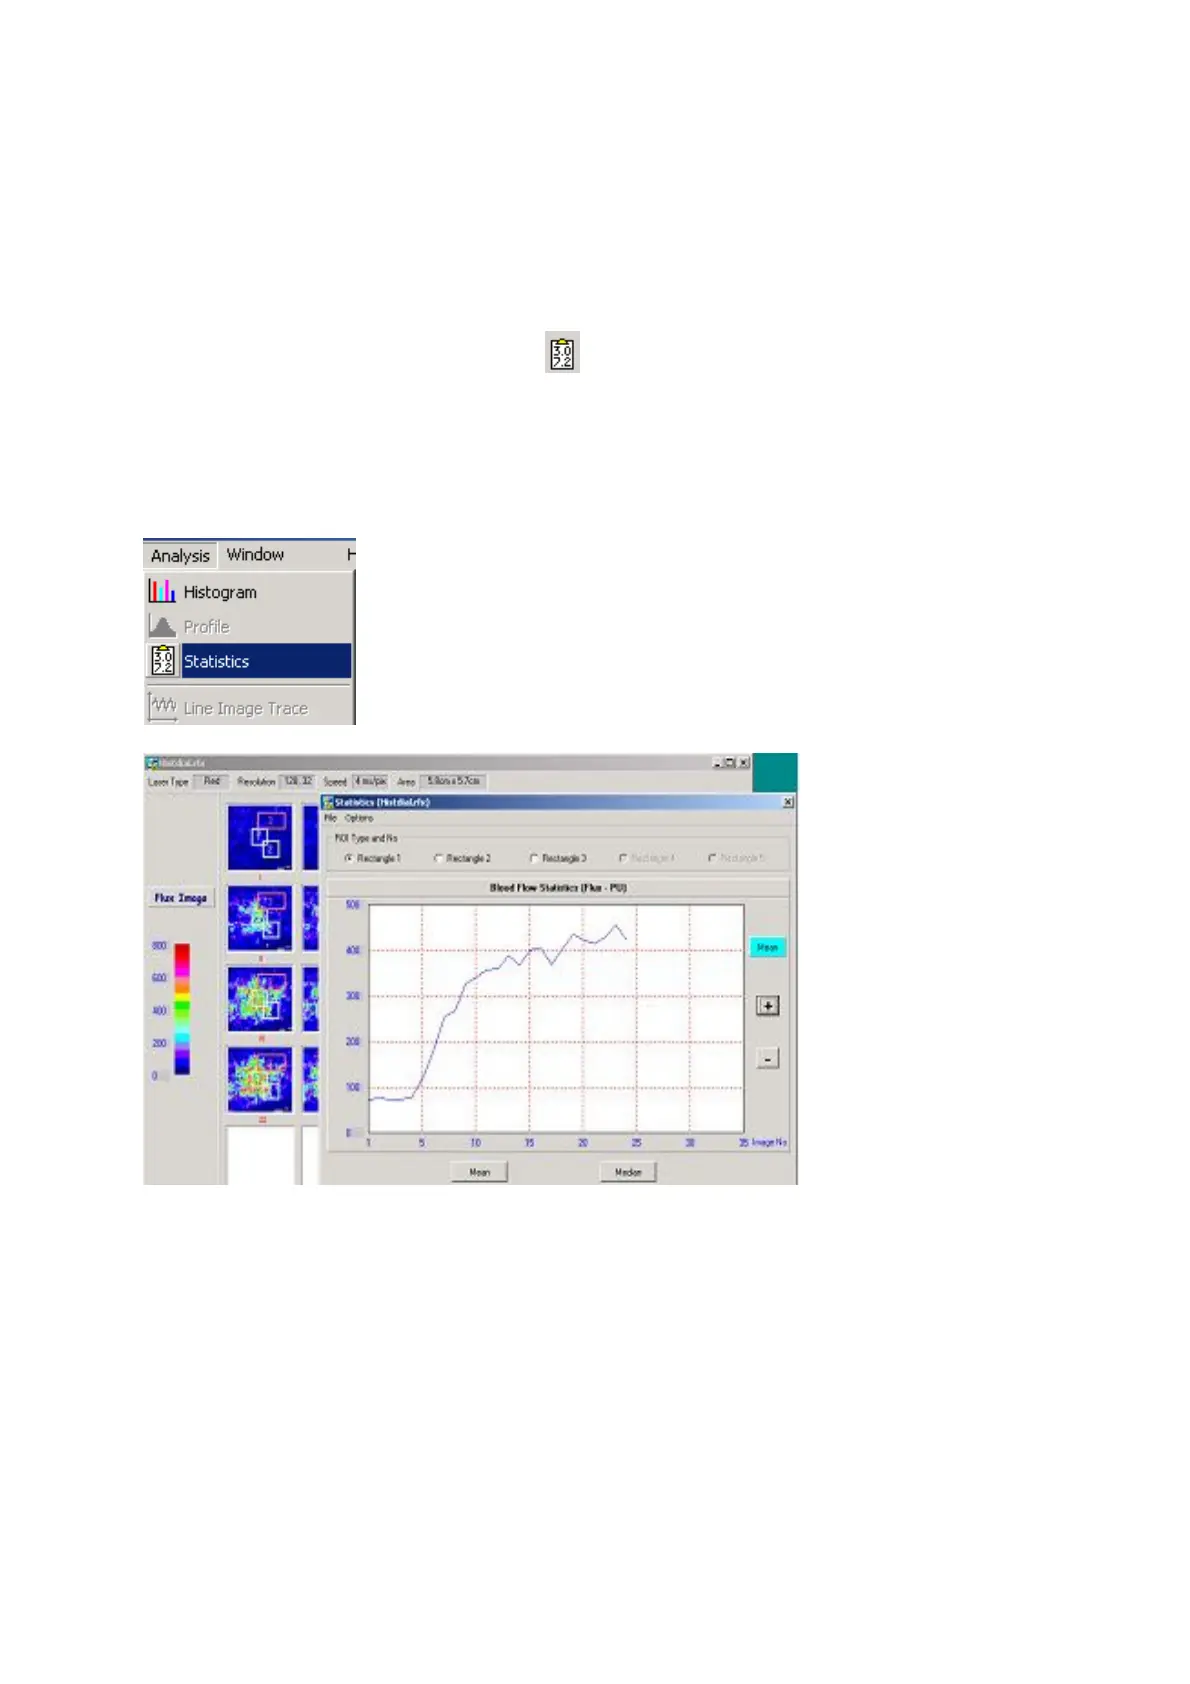
16.1.2 STATISTICS – REPEAT SCAN
The basic statistics of flux and dc values within a region of interest (ROI) can be obtained in the
same way as for single images. (Section 14)
The example below shows a repeat image with 3 ROIs defined. The Statistics window is opened by
Selecting
Analysis
followed by
Statistics
To display the statistics graphically (Curve) select:
Options Curve
In the above example ROI 1 is selected for the graphical display of the 25 image repeat scan.