MOOR INSTRUMENTS moorLDI2 RESEARCH USER MANUAL
92
15.4
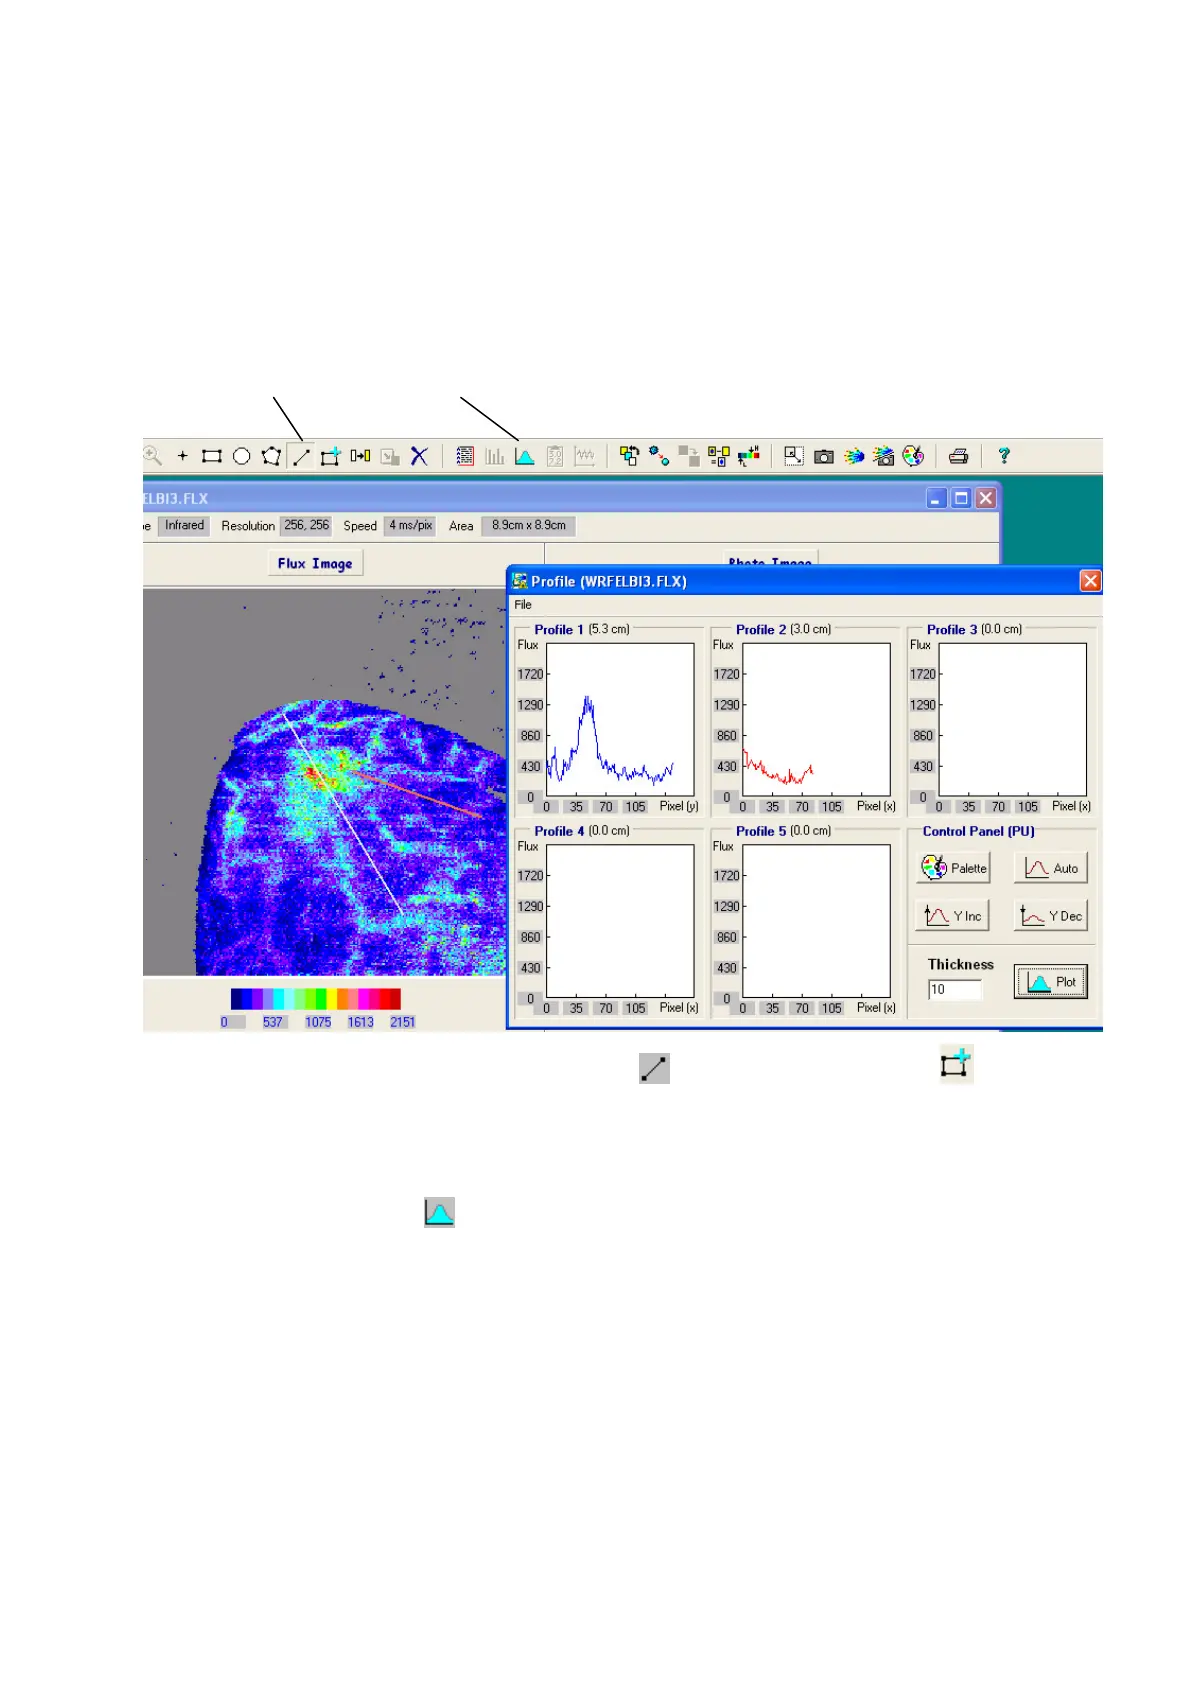
PROFILE
15.4.1 INSERTING PROFILE LINES
The Profile analysis can only be selected after a line has been defined across an image. To achieve an
averaging affect a wide line (in the example below it is 10 pixels wide) can be defined from the
profile window.
Profile line Plot Flux values along Profile lines
To define a line on the image click on the line icon followed by the insert icon (or the Insert
key on the keyboard) and then move the cursor and click at the start position. Move to the end
position and click again. This can be repeated upto 4 more times to give 5 different lines An
example of a profile analysis for 2 lines is shown above.
15.4.2 PROFILE DISPLAY
Click on the profile icon to create a profile window of flux against pixel number as shown above.
The direction of the profile is the direction in which the profile line was defined and the line co-
ordinates are displayed in the lower left corner of the Profile window.