MOOR INSTRUMENTS moorLDI2 RESEARCH USER MANUAL
146
2.5 PROTOCOL ANALYSIS
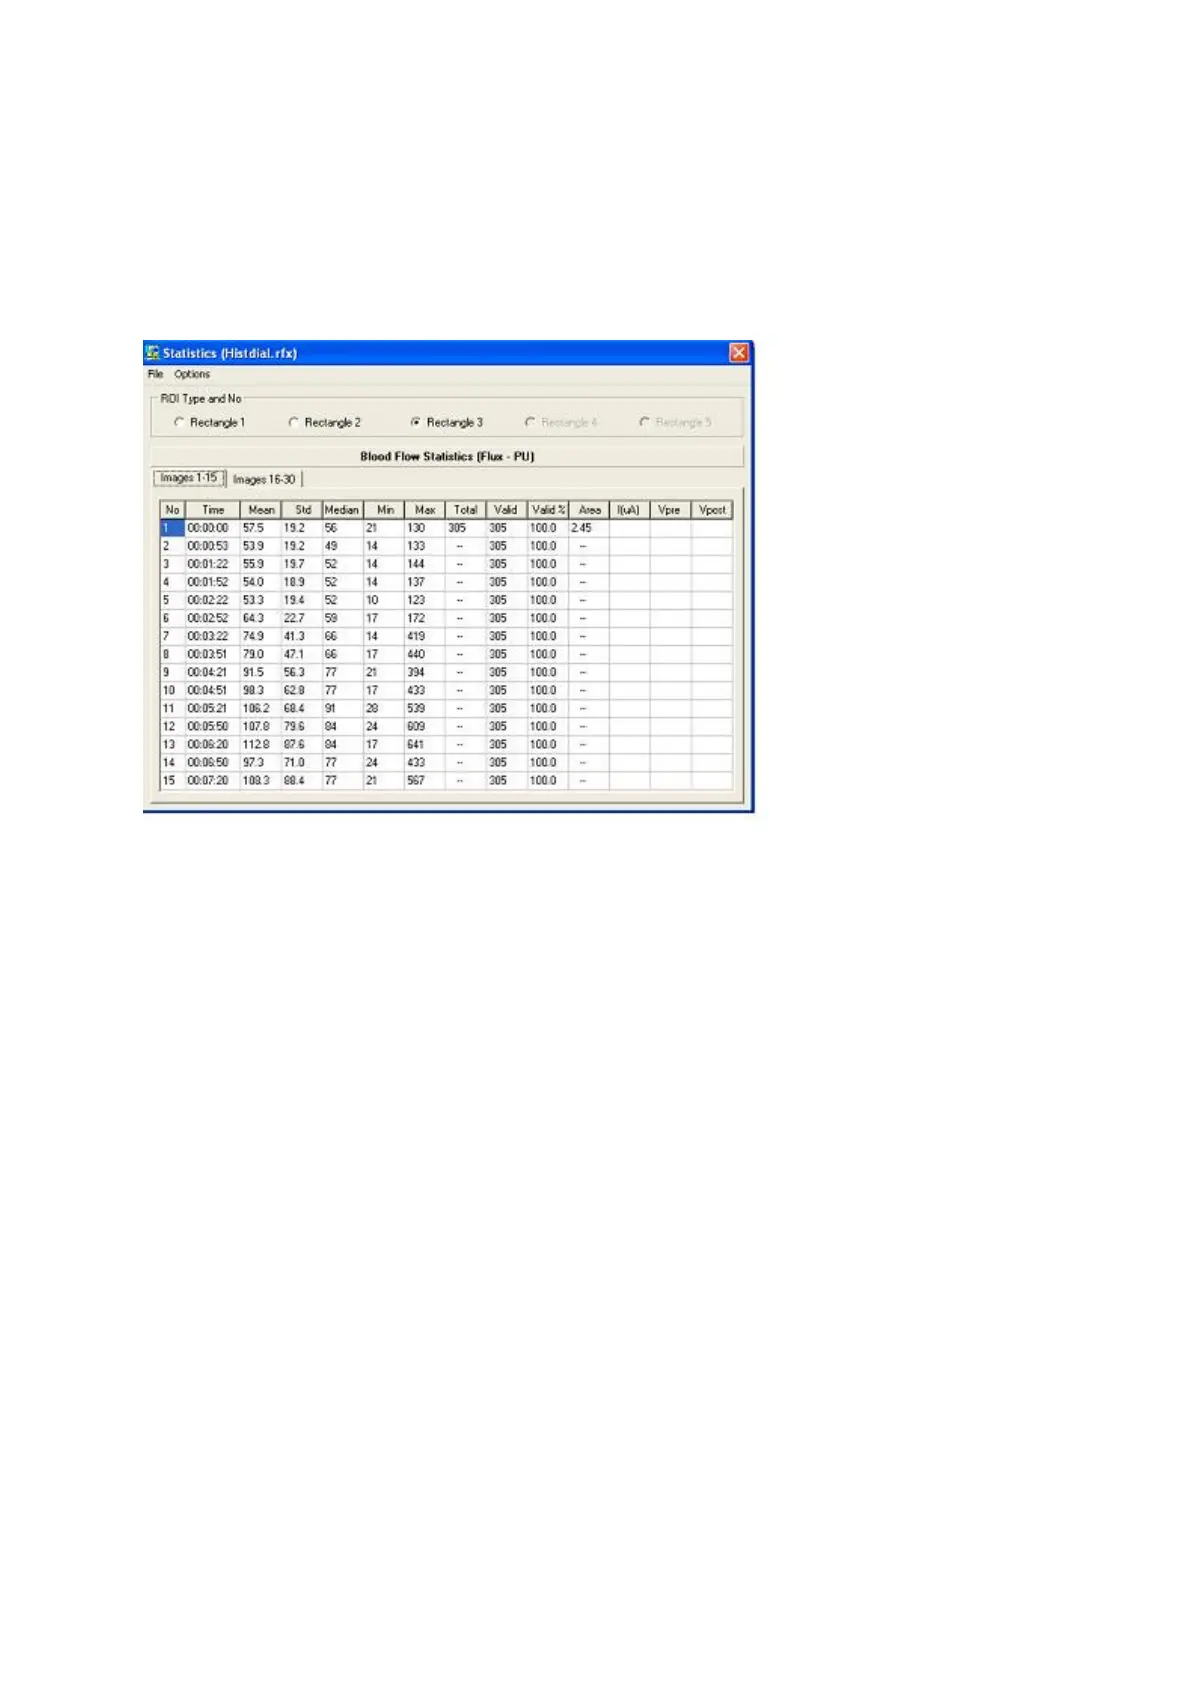
Iontophoresis responses are assessed after selecting a region of interest (ROI) on the flux or DC
image corresponding to the area iontophoresed. Statistical analysis of the ROI tabulates results for
flux and dc levels, as per the standard
moorLDI
analysis, and also tabulates set current (I[uA]) and
voltages (V1 and V2[V]) measured at the start and end of a scan interval.
Note that the initial iontophoresis voltage is measured 0.5 seconds after the start of each scan and the
second measurement is made immediately before the end of each scan interval. The initial delay is
necessary to enable voltage to reach a meaningful value close to the initial peak and the second
measurement records the final, plateau level. (It is not possible to monitor voltage continuously by
moorLDI
, due to image data requirements. This feature is available on the DRT4 laser
Doppler/Temperature Monitor.)
Both voltages are displayed during measurement and review below the corresponding repeat scan
image. The set current (I) can be used to calculate skin resistance: the current will be accurate to
within +/-1uA unless resistance is too high and voltage approaches the 27 V maximum.