MOOR INSTRUMENTS moorLDI2 RESEARCH USER MANUAL
89
15.2.3 FILE - PRINT
Select
F
ile,
P
rint to print out the statistics window.
15.2.4
FILE – EXIT
Select
E
xit to remove the statistics window.
Users of Windows
95 can click on the X at the top right hand corner of the window to close.
15.2.5 OPTIONS
Option: Flux Statistics Display Flux statistics results.
Option: LD Photo Statistics Display LD Photo statistics results.
Option: Copy to Clipboard Copy the current statistics table to clipboard, so that it can be
pasted to other program (e.g. MS Excel)
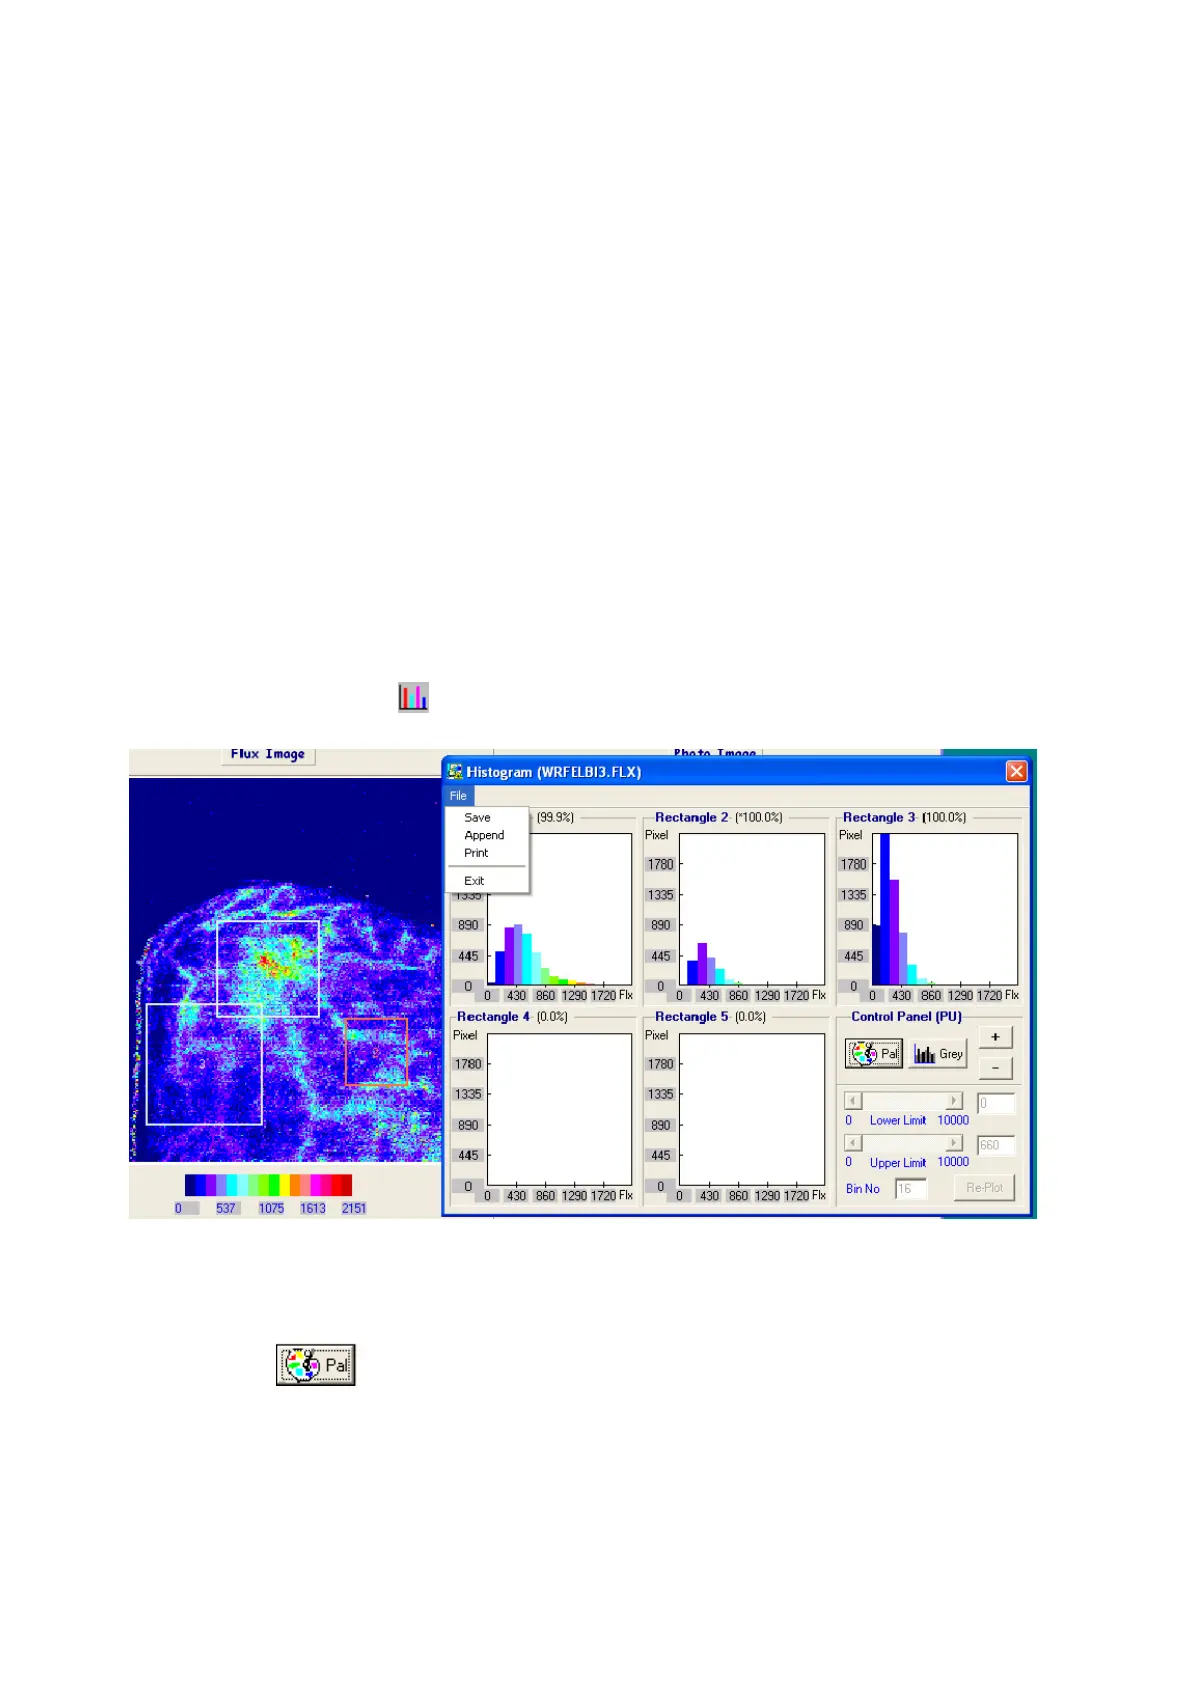
15.3 HISTOGRAM
The
Histogram
analysis can only be selected after an ROI (Section 13) has been defined.
Select the histogram icon and a window similar to that shown in section 13.5.4 is displayed.
Two histogram display modes are available:
Palette mode :
when this option is selected, a fixed Bin Number of 16 will be used, also the palette limits of the
current image window will be used as the lower limit and upper limit in the histogram calculation.
These three parameters are not editable in the Histogram window. The histogram bar colour will
correspond to image colour (ie either the 6 or 16 colour pallette).