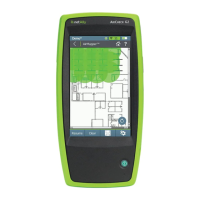
Frequency Spectrum View
This display uses the color spectrum to present
a heatmap of the frequency band you have
chosen, showing the density of recent RF meas-
urements.
l
Blues and greens ("cool" colors) indicate less
RFdetected at that frequency and
amplitude.
l
Yellow, orange, and red ("hot" colors)
indicate the repeated presence of RF at that
frequency and amplitude.
l
Darkest blue indicates infrequent RFs while
red indicates the continuous presence of
RFat that amplitude.
Spectrum Test App
672