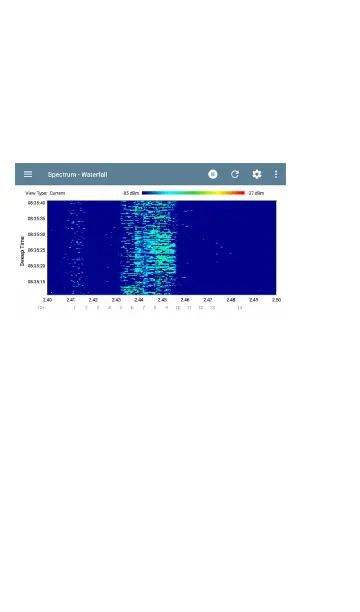
Waterfall View
The Waterfall display draws new data at the top
of the display as it scrolls older data downwards
over a 2-minute interval. This provides a visu-
alization of RFactivity over time.
l
The vertical access shows the measurement
time, and the horizontal axis shows
frequencies and channels.
l
The colors in the waterfall represent the
amplitude of a frequency at a certain time
according to the scale in the upper right.
Dark blue shows lower amplitude meas-
urements, and lighter colors show higher
amplitude signals. More colors indicate more
activity. For example, in the waterfall shown
Spectrum Test App
673