56 System Operation
data and place them in a data buffer on a first-in-first-out (FIFO) basis. The
statistics shown are representative of data collected since the time Clear
Stats was last pressed. As in Fixed mode, the Clear Stats soft key can be
pressed at any time to restart the whole process again.
The Soft keys offer the user the option to clear the statistics at any time,
with Clear Stats soft key.
The Graph soft key (Section 4.7.1) can be used for the visualization of the
measured values on a time graph.
The Statistics screen displays also the current measured value at the top of
the right column. At the bottom of the same column the system displays the
primary channel signal frequency. Section 5.9 gives a more in depth
description of the Frequency measurement.
This screen also provides users access to all the samples collected if
statistics are performed in Fixed mode. In this mode, a “Save” soft key
becomes visible (not shown in figure above) after all the samples requested
have been collected. Pressing this soft key will cause the power meter to
save the collected data to a flash drive connected in the front-panel of
power meter.
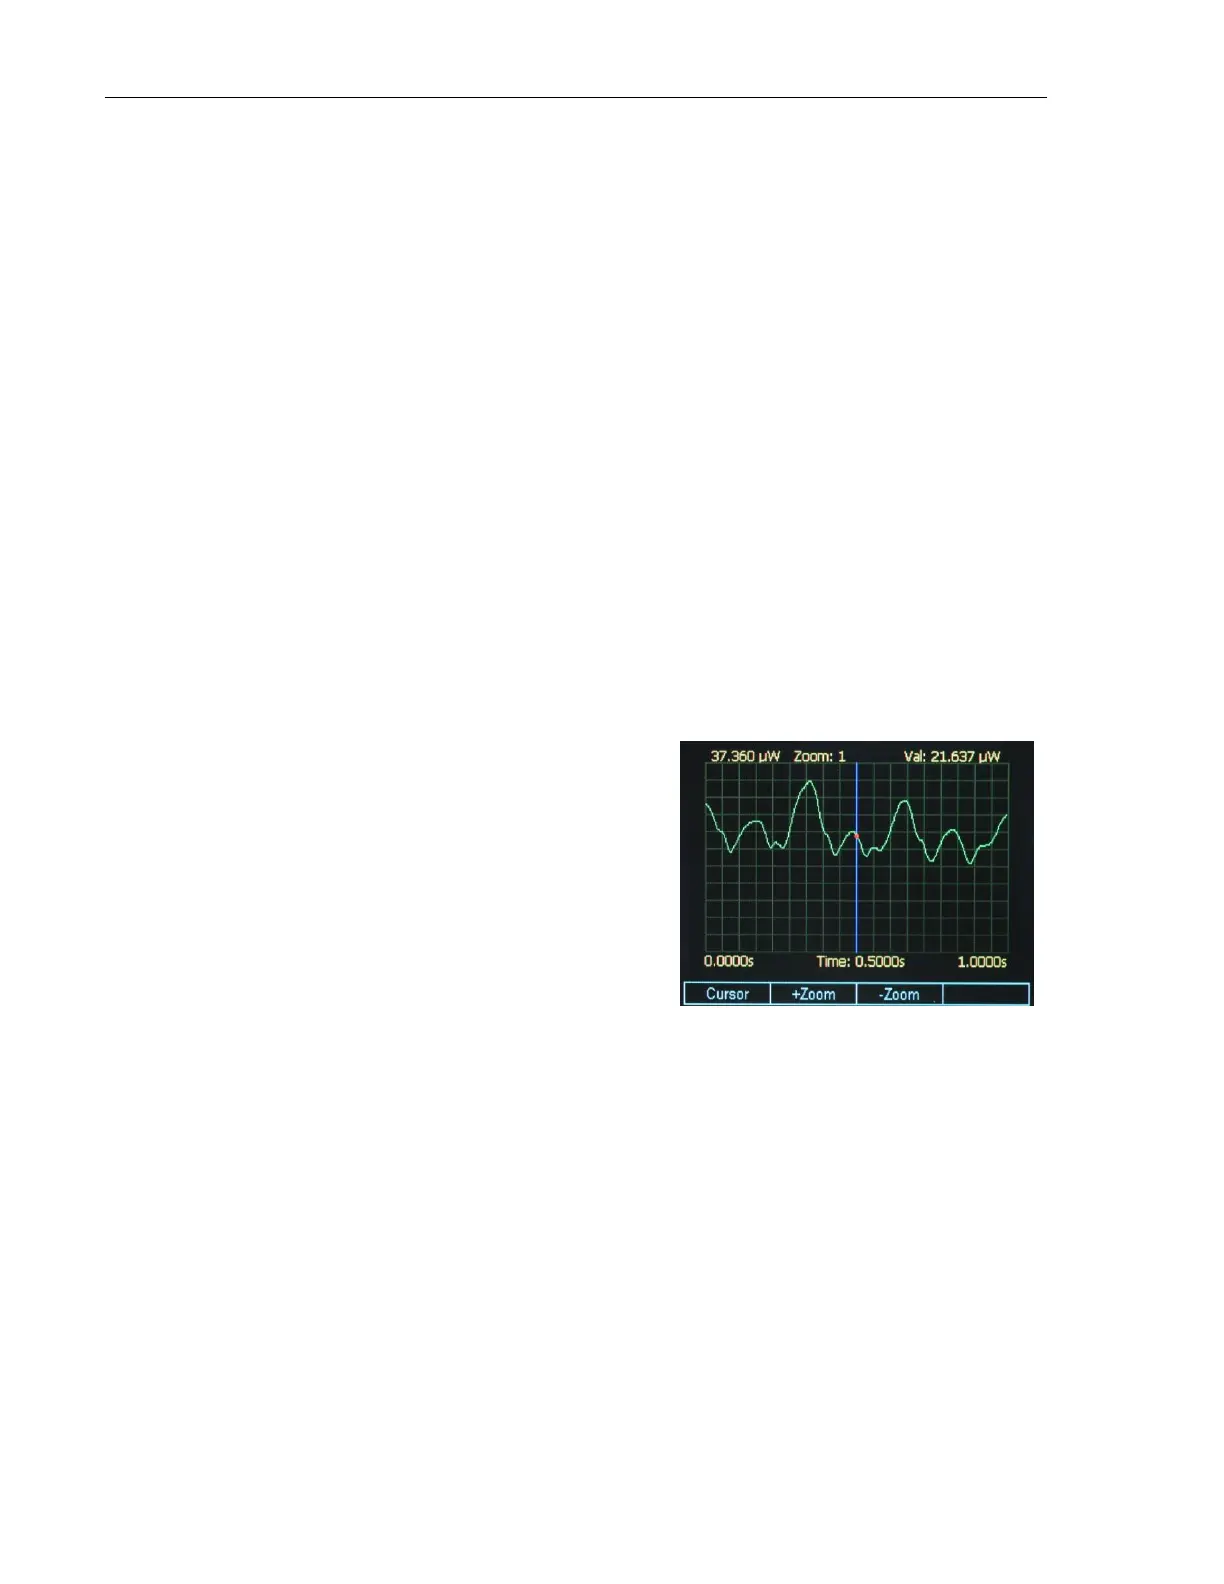
4.7.1 Graph
The Graph soft key displays the last
10000 measurements on a time graph
(Figure 48). Due to the sample time
interval of 100μs, the graph duration
is 1 second. The graph width is 270
pixels and, because of that, the
system has to decimate the 10000
samples to fit them in this fixed
number of pixels. Therefore, the
graph might look choppy if the graph
zoom is set on 1.
The user can zoom into the graph with the Soft keys +Zoom and –Zoom. As
the zoom changes the graph displays a finer picture of the measurements.
The zoom value is retained at the top of the screen. Pressing the +Zoom soft
key will zoom in the graph 2 times the previous zoom value. Pressing the –
Zoom soft key will zoom out ½ times the previous zoom value.
The maximum graph value is displayed in the upper left corner of the
display. If the Cursor soft key is pressed, a vertical line (cursor) is
displayed. The user can direct the cursor left or right with the Navigation
Keys to read the measured values on the graph. The current value is
displayed in the upper right corner and marked on the screen with a red dot.
 Loading...