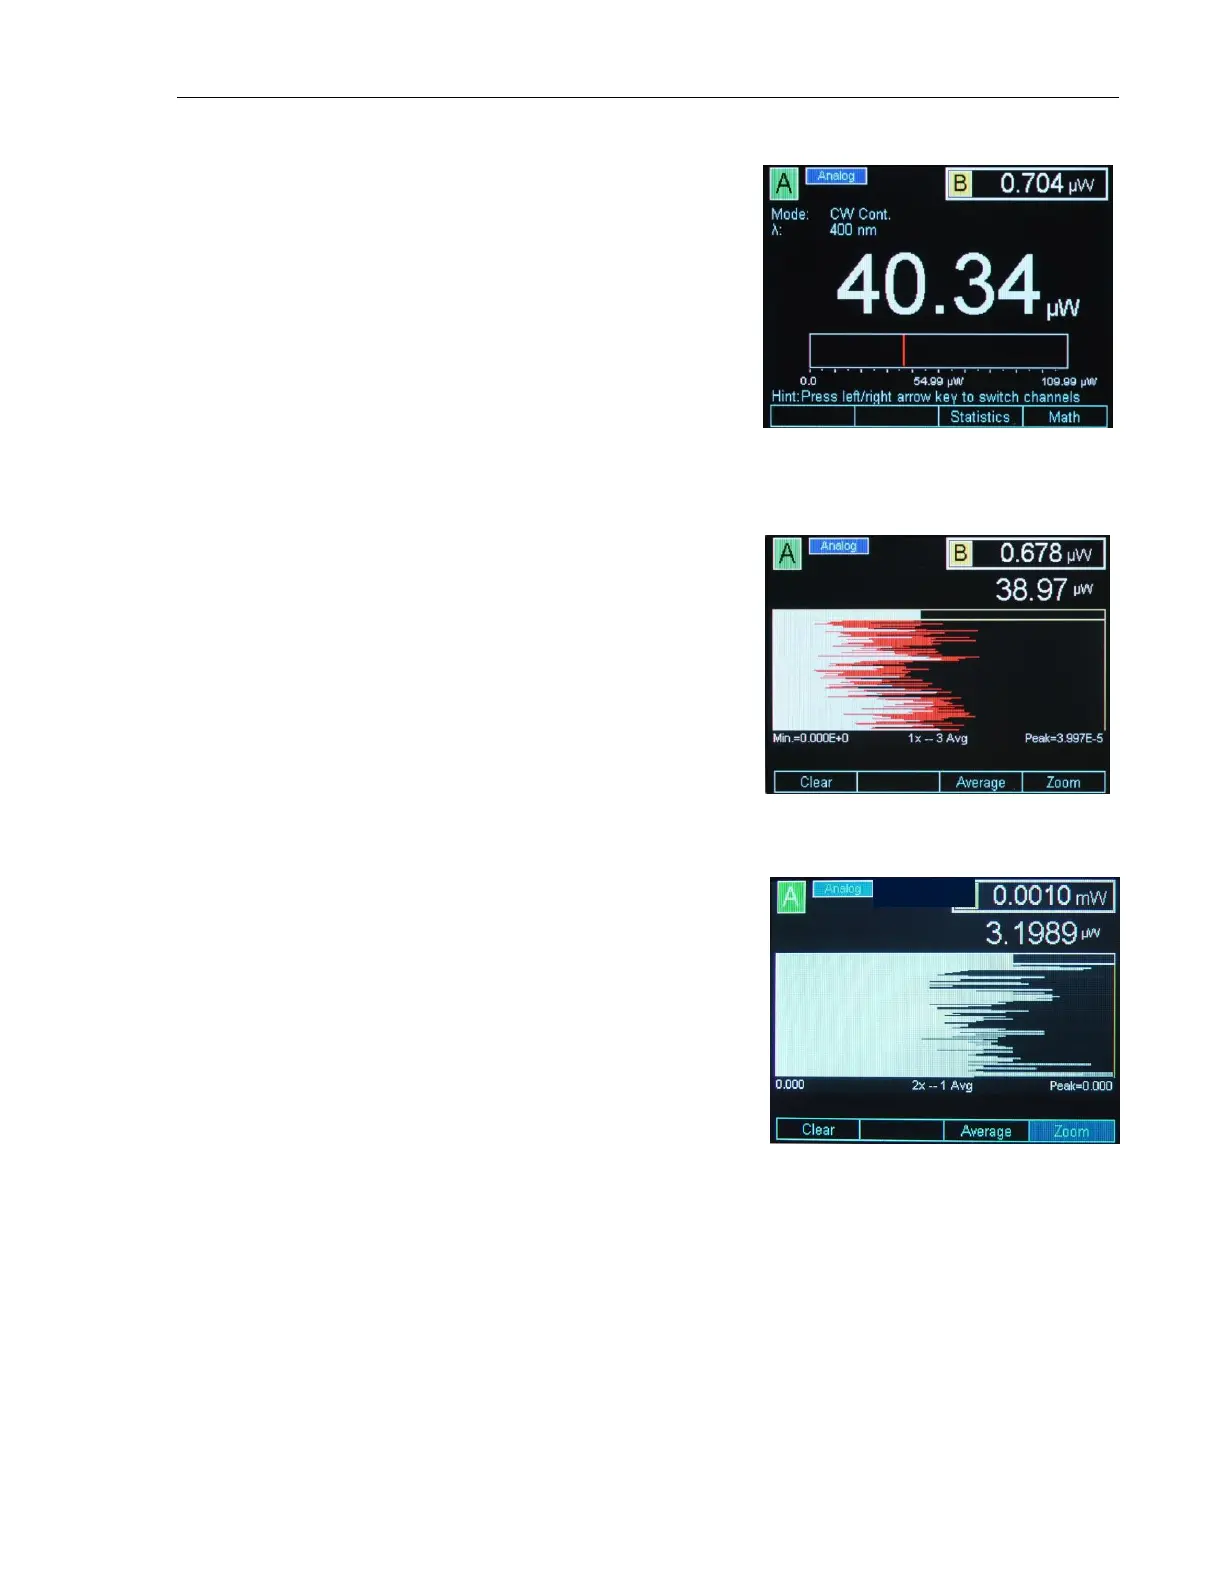
The Analog Needle displays a vertical
marker that moves with the displayed
numeric value. It is useful for users
who look for a maximum or a
minimum when adjusting the optical
power.
When the Vertical Chart is selected
the numeric display is moved in the
upper right corner, just below the
secondary channel display. The
vertical chart scrolls down,
representing a snapshot of the last
measurements. The chart can be
cleared with the Clear soft key. The
maximum peak value of the chart is
the maximum measurement of the
entire chart, since the last clear.
Below the chart, there is a line with
the chart maximum and minimum in
major units. On the same line in the
middle, there is information about
the chart zoom level, e.g. 1x, and the
number of samples processed per
chart line, e.g. 3 Avg (Figure 58).
The chart has 100 lines, each line
having a white and red color. When
the system fills up a line, it looks at
a number of samples defined by the
number displayed below the chart.
Figure 58 shows 1x -- 3 Avg, which means that, while painting a line, the
system looks at the previous 3 measurements. It displays with white the
minimum value in the 3-measurement list and with red the maximum value
in the same list.

 Loading...