5.13
Date Code 20081022 Instruction Manual SEL-787 Relay
Metering and Monitoring
Through-Fault Event Monitoring
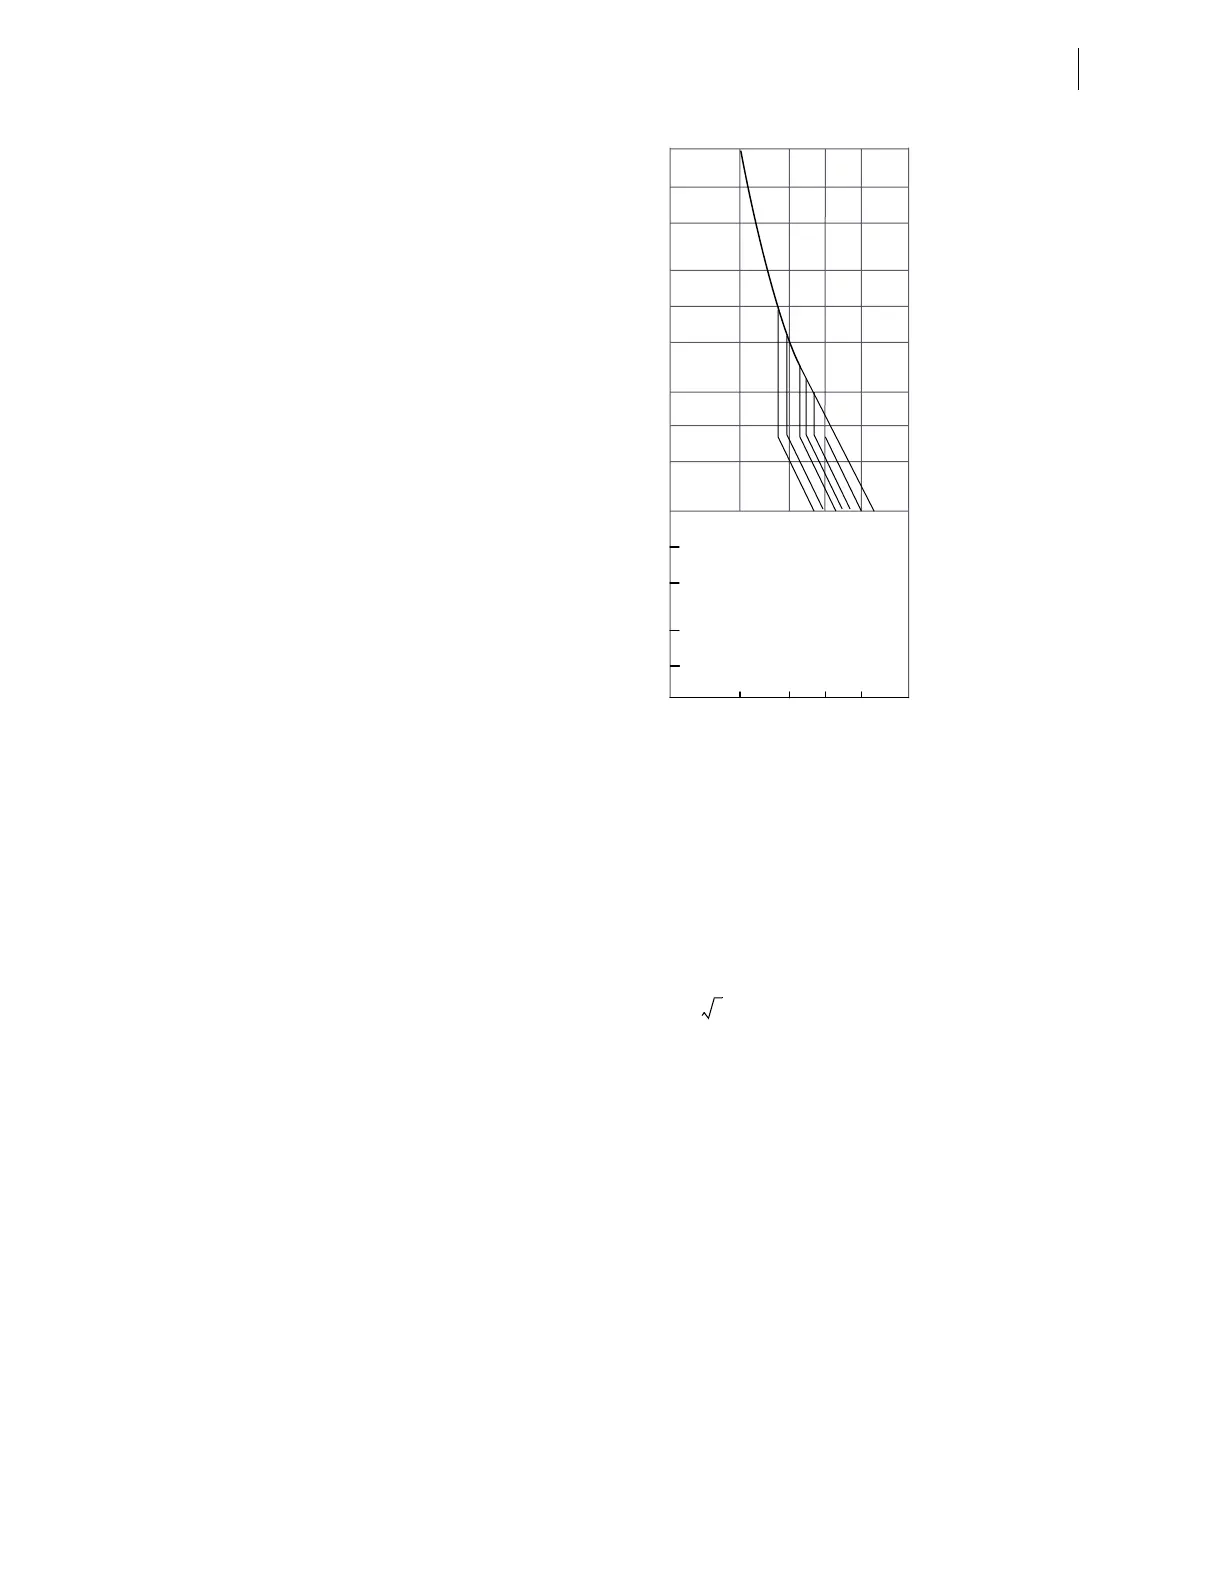
Figure 5.17 Category IV Transformers Through-Fault Protection Curves
The curves in Figure 5.17 are a function of the transformer short-circuit
impedance, and is keyed to the maximum I
2
t of the worst-case mechanical
duty (maximum fault current for 2 seconds). Equation 5.1 through
Equation 5.3 show the three equations that the element uses to evaluate the
thermal curve each processing interval. Note that the calculated currents are in
primary values. To convert the secondary current to primary current, the
element multiplies the secondary current by the CT ratio of the particular
winding.
Equation 5.1
Equation 5.2
Equation 5.3
where:
I = Measured current
S = Transformer MVA rating (MVA)
kV
LL
= Line-to-line voltage (kV)
Z
PU
= Transformer impedance (per unit)
K = 1250 if (4.5 ≤ I
PU
≤ 0.5 • I
MAX_PU
)
or
2 • (I
MAX_PU
)
2
if I
PU
> 0.5 • I
MAX_PU
% Transformer Impedance
Time (seconds)
2000
1000
500
200
100
50
20
10
5
2
1
0.5
0.2
0.1
Times Normal Base Current
21055020
12 10 8 7 6 5 4
For fault current from 50% to 100% of
maximum: I
2
t = k
where:
I = symmetrical fault current times
normal base current
k = constant determined at maximum
I with t = 2 seconds
I
PU
=
I3kV
LL
••
1000 S•
----------------------------------
I
MAX_PU
=
1
Z
PU
----------
tI
PU
() =
K
I
PU
()
2
----------------