Art. no.: 2.511407 Rev.: a
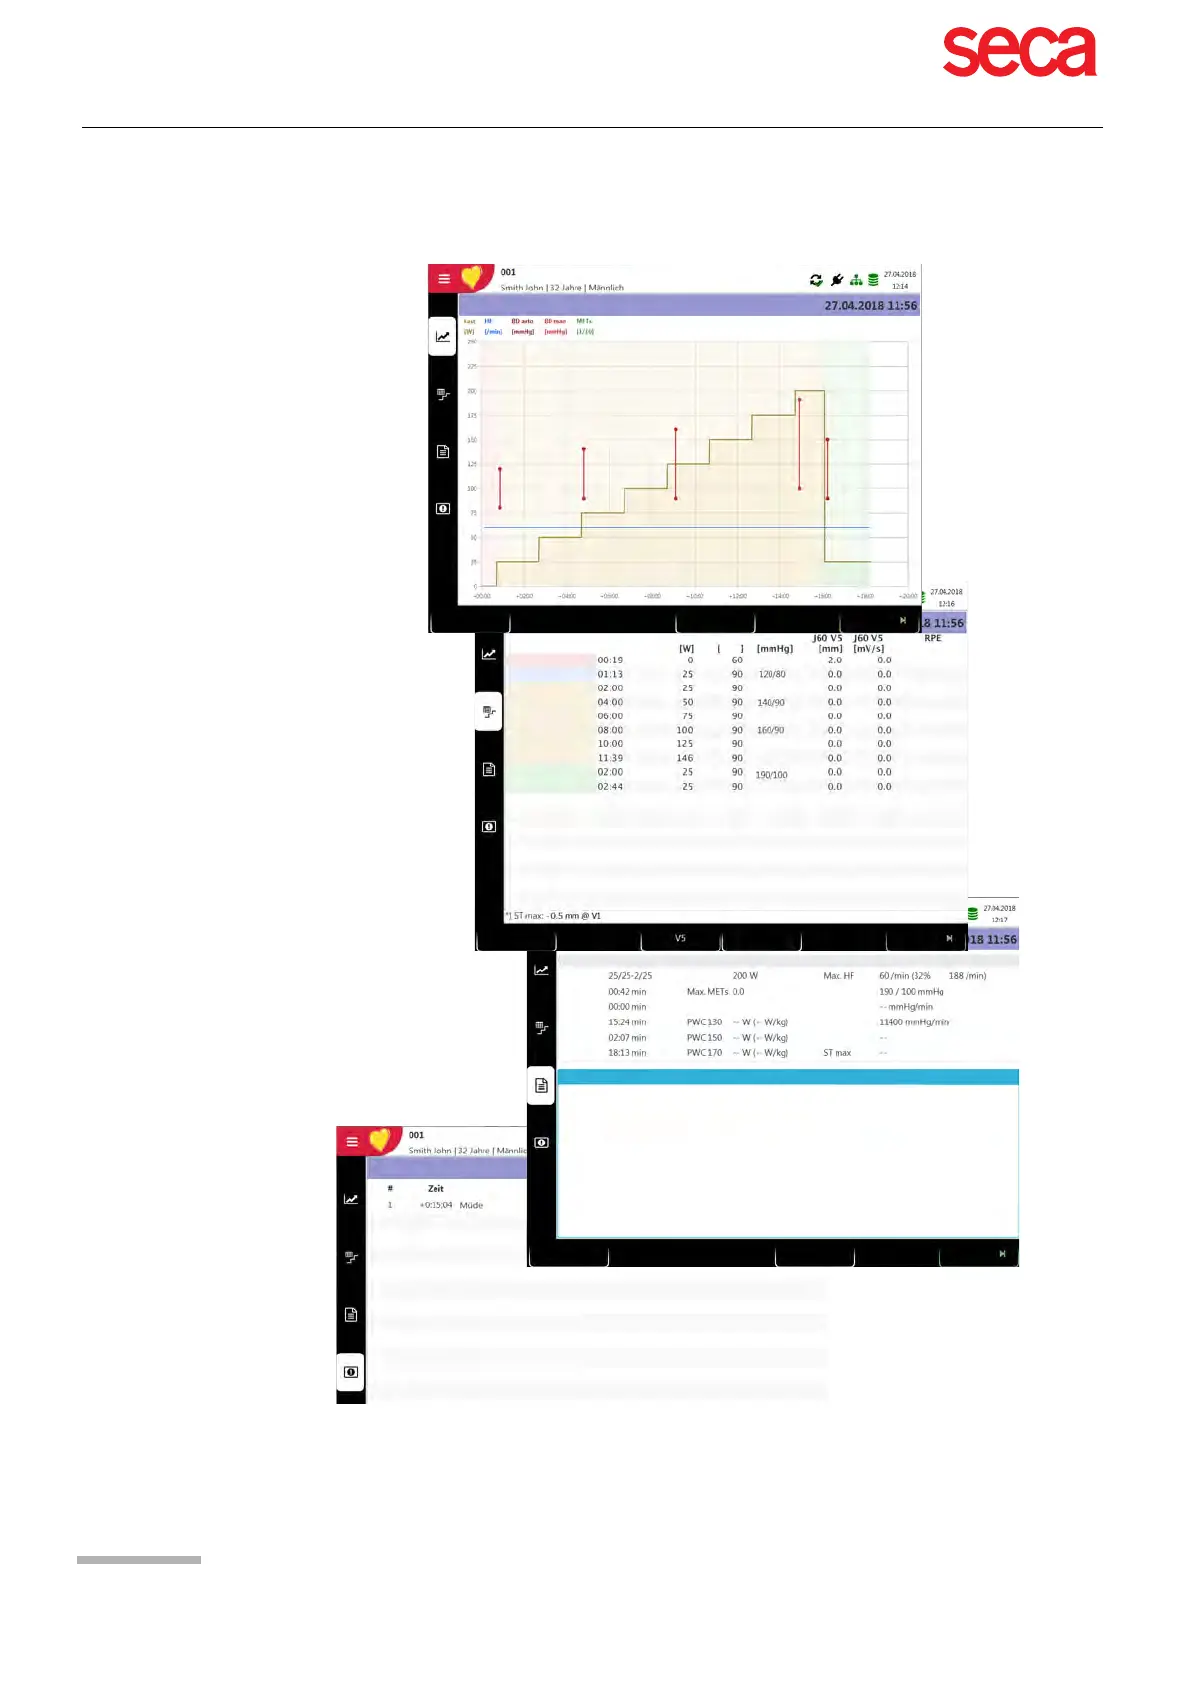
Trend view with graphic presentation of:
• Load stages
• Blood pressure Auto/Manual
• Heart rate
•METs
Display of the following data in table format:
• Load stages with phase and load
• Heart rate
• Blood pressure
• ST amplitude and elevation for selected J
point and lead
•RPE
• Max. ST in the bottom bar (the load stage in
which the max. ST occurred is marked with
" * ").
Display of summary of the exercise test with
interpretation
Display of the manually
entered results during the
test.
Accept
Patients
Print
Accept
Patients
Print
Accept
Patients
Print
Exercise 1
Warm-up 1
Exercise 2
Exercise 3
Exercise 4
Exercise 5
Recovery 1
End of test
Sitting 1
Step
Phase
Load HR
BP
Summary
Interpretation
Protocol
Prephase
Warm-up
Exercise
Recovery
Total
Max. load
Max. BP
of
Min. BP x HR
Max. BP x HR
DP factor
According to protocol 25/25-2/28, the patient has trained during 15.24 minutes and has reached a load of max. 200
watts, which corresponds to --% of the maximum load. The HR at rest was 60/min at the beginning, went up to a max
HR of 60 /min, what corresponds to 32% of the max. target HR based on the age. The BP at rest was --/-- mmHg,
went up to max. BP of 190/100 mmHg.
Exercise 6
/min