Operation
MCS100E Operating Instructions 8009504/VYWA7/V3-1/2018-01 © SICK AG 53
Subject to change without notice
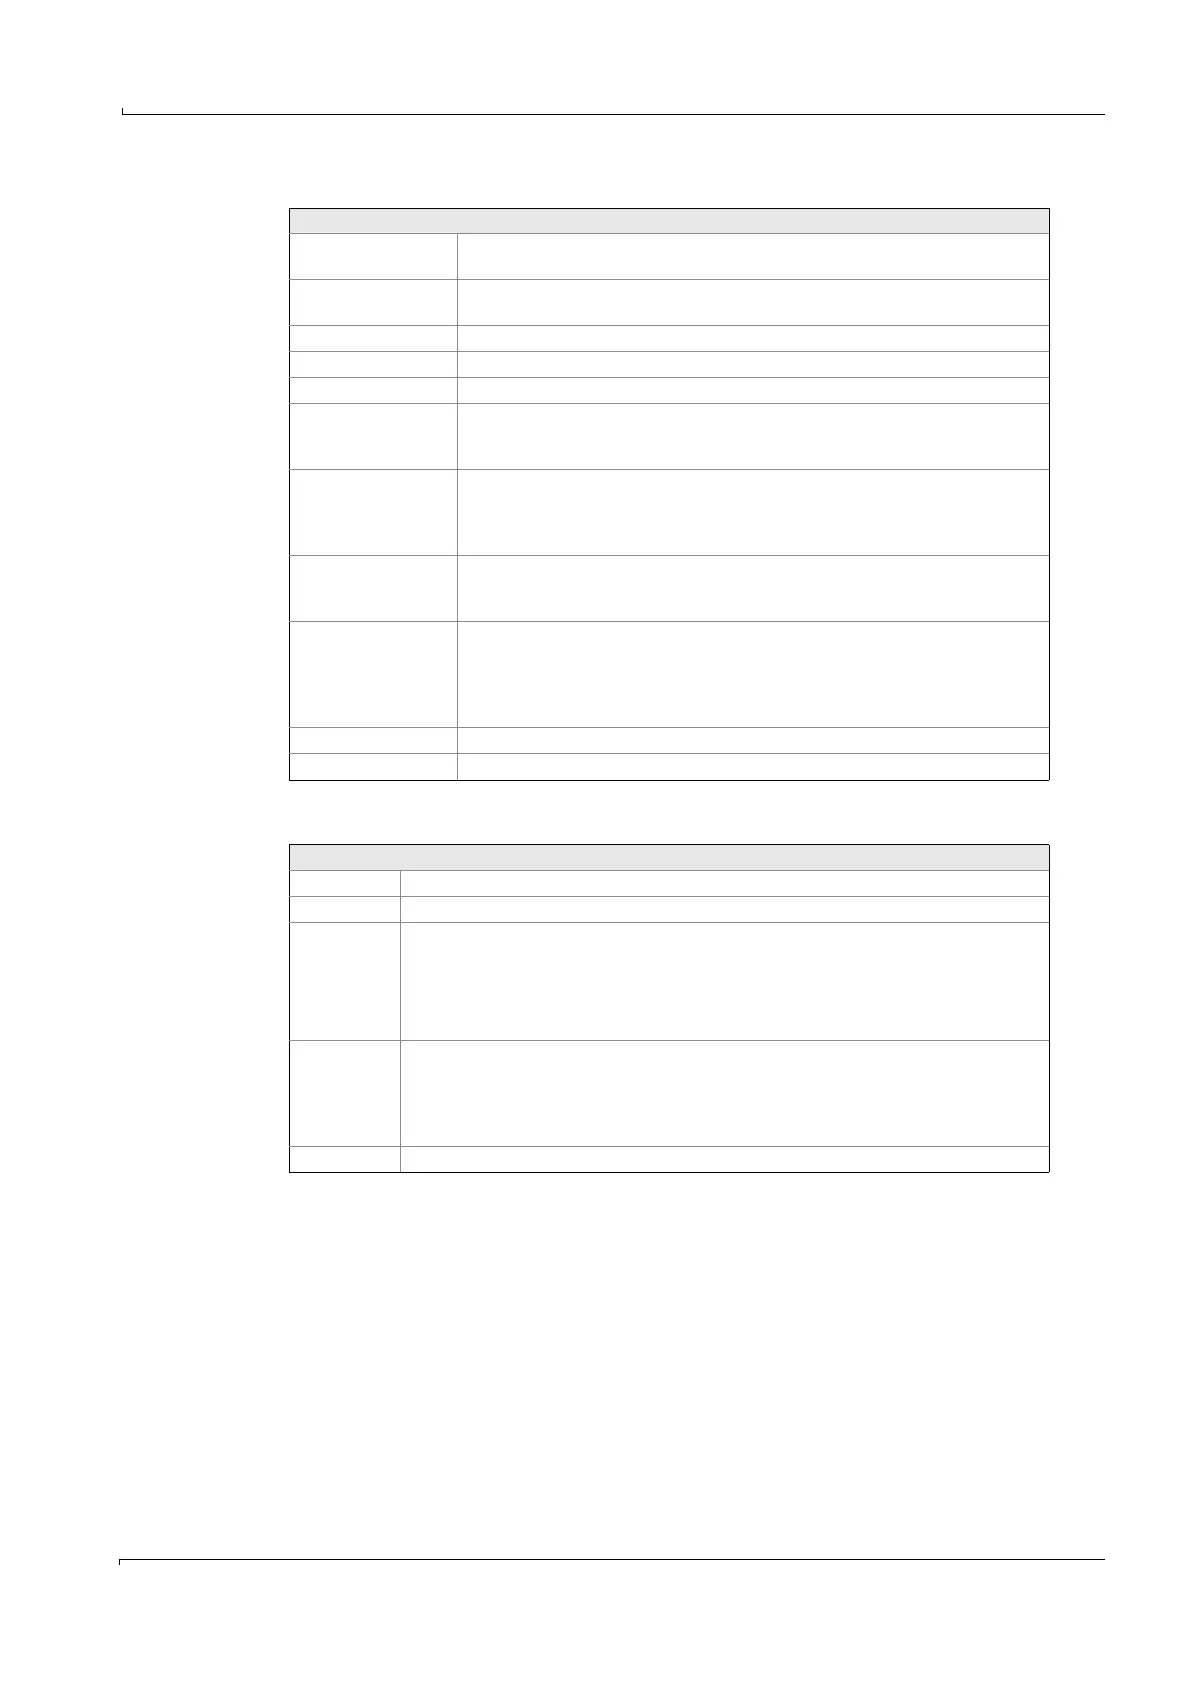
Legend
Measurement
sequence
Name of measurement sequence.
Start If “Actual”: Start time of measurement sequence
If “Archive”: Start time of file
File Name (and thus time of creation of file)
1
.
1
Displayed only if data storage is active.
File size Actual size of data file.
Free Memory still available on hard disk.
Time Time at cursor position.
If “Actual”: If no key was pressed for 10 seconds, the cursor jumps back on the
time axis to the end of the recording.
K1..K8 Represent the first 8 curves from Specialist: System edit: Graphic output with
- name of component
- measurement range
- measurement value at cursor time
Units, left Units of the first group of components which have an identical scale. The scale is
derived from Main menu: Configuration: Graphic output: Measurement ranges
and is automatically adapted to the current measurement range.
Units, right Units of the second group of components which have an identical scale.
All further units (of the up to 16 possible components) are displayed at the right
hand side and are scaled automatically according to their individual
measurement range (bottom 0%, top 100% of the measurement range,
independent of the scale displayed).
Time axis Time displayed
Status messages Upper (2
nd
) and lower (1
st
) status bar with current status messages
2
.
2
If the status bar is empty: There is no current message
Key assignment
<- and ->: Move time axis
<5> Display of number of curve on/off
<F1> Help menu, there
0: If “Current“: Cursor to end of data recording.
If “Archive“: Non-stop data display
6: If “Current“: Cursor to end of data recording.
If “Archive“: Data display until end of screen
<F8> Menu with:
- Archive values
- Time axis
- Bar graph
<ESC>: Create new scale for graphic
<ESC> Quit graphic.
 Loading...
