Operation
54 MCS100E Operating Instructions 8009504/VYWA7/V3-1/2018-01 © SICK AG
Subject to change without notice
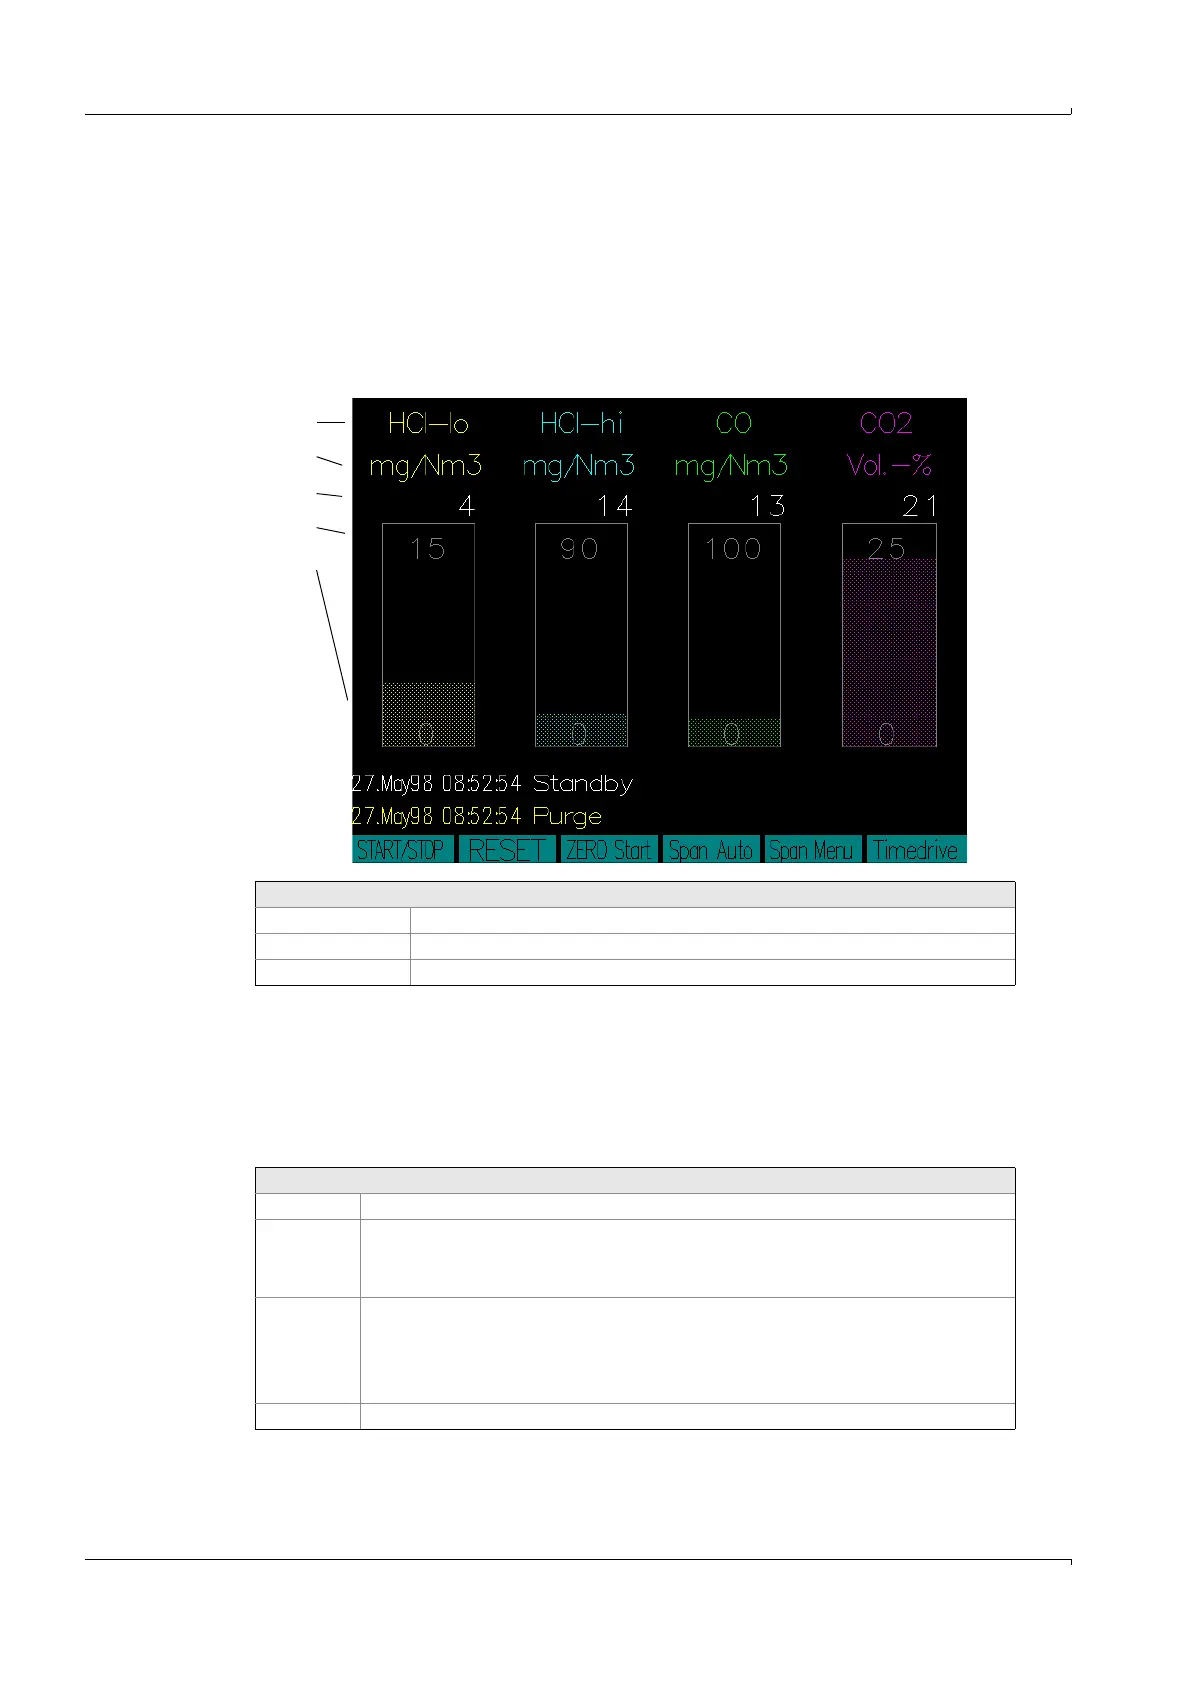
5.7.5.2 Graphic output: Bar graph
In this menu, the measured values are displayed as bar graph (assignment from Specialist:
System edit: Graphic output).
Max. 4 (of 16) bars can be presented at one time.
• The name of the measurement and the time are displayed in the first line (
→
p. 52,
§5.7.5.1).
• Underneath the names of the components the corresponding measurement ranges and
measured values are displayed (numerically and as bar graph).
5.7.5.3 Archive Data
The measuring values stored in the archive are displayed.
You are prompted to enter the start time (see next chapter).
The graphic output of the values stored in archive corresponds to that of the actual values
in Main Menu: Display graphic Graphic output: Time History.
There is no influence on the current measurement sequence.
At the end of a data file the next file in chronological order is opened automatically and the
data continues to be displayed.
Key assignment:
<- and -> Move bar and display next bar.
<F8> Switch over to graphic “Time axis”.
<ESC> Quit graphic and return to Main Menu
Key assignment
<- and ->: Move time axis
<F1> Help menu, there
0: Non-stop data display (Stop: Press any key)
6: Display of data until end of screen or press any key
<F8> Menu with:
Display of current values
Scale time axis
Data reduction (indicated value x means: every xth measured value is to be displayed)
<ESC>: Create new scale for graphic
<ESC> Quit graphic.
Component
Unit
Measured value
Measurement range
Bar