Operation
52 MCS100E Operating Instructions 8009504/VYWA7/V3-1/2018-01 © SICK AG
Subject to change without notice
5.7.5 Display graphic
Main Menu: Display graphic
In this menu option, you can select the graphic output of the measured values.
The graphic is displayed automatically after the start of the measurement program or if no
key has been pressed for 10 minutes (parameter KT upon program start).
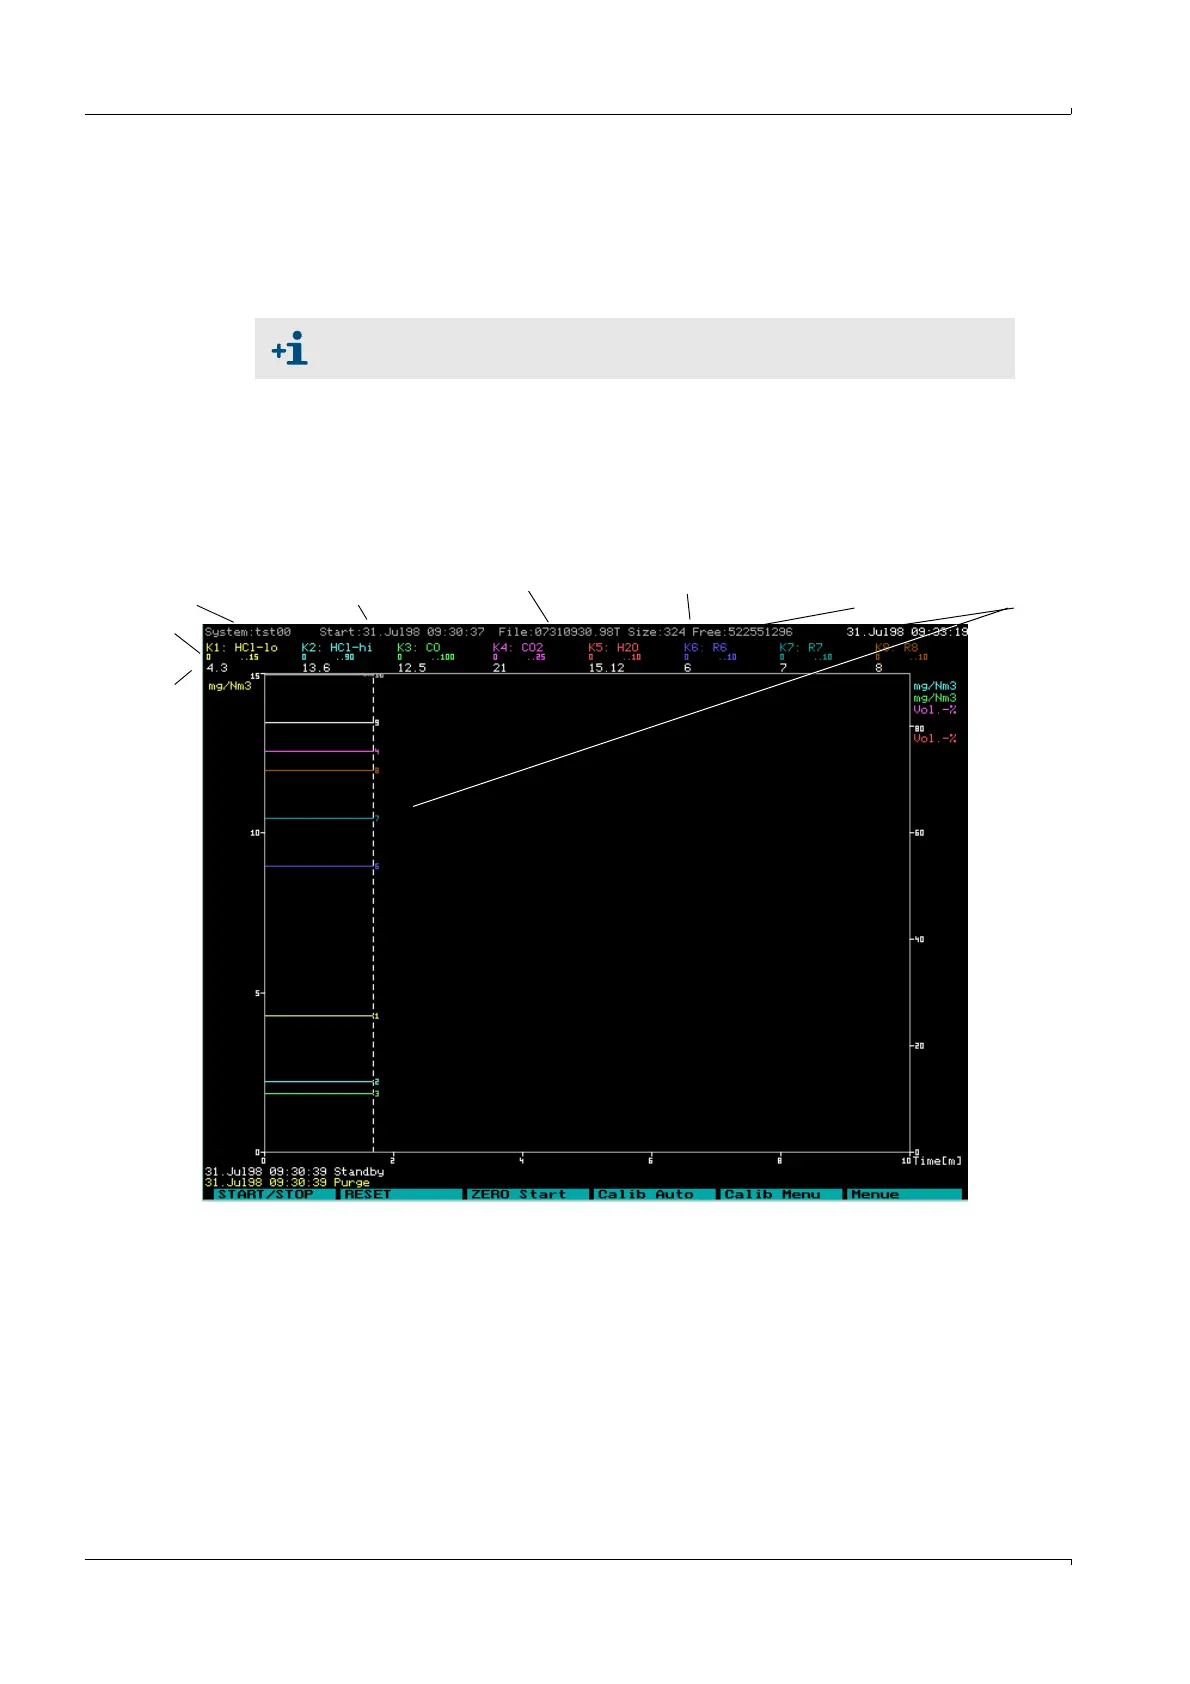
5.7.5.1 Graphic output: Time history
In this menu, the measured values are displayed over time, whereby totally 16 components
can be represented:
• Max. 8 components as lines with numerical values for measurement range and
measured value.
• Further 8 components as lines only.
If a menu is presented in the graphic, the graphic output will not be updated.
Measurement sequence
(= system)
Start time of
measurement
File File size Free
space on hard disk
Time at
cursor position
Measure-
ment range
Measured
value