Code Composer Studio
TMS320F2837xD Microcontroller Workshop - Programming Development Environment 2 - 11
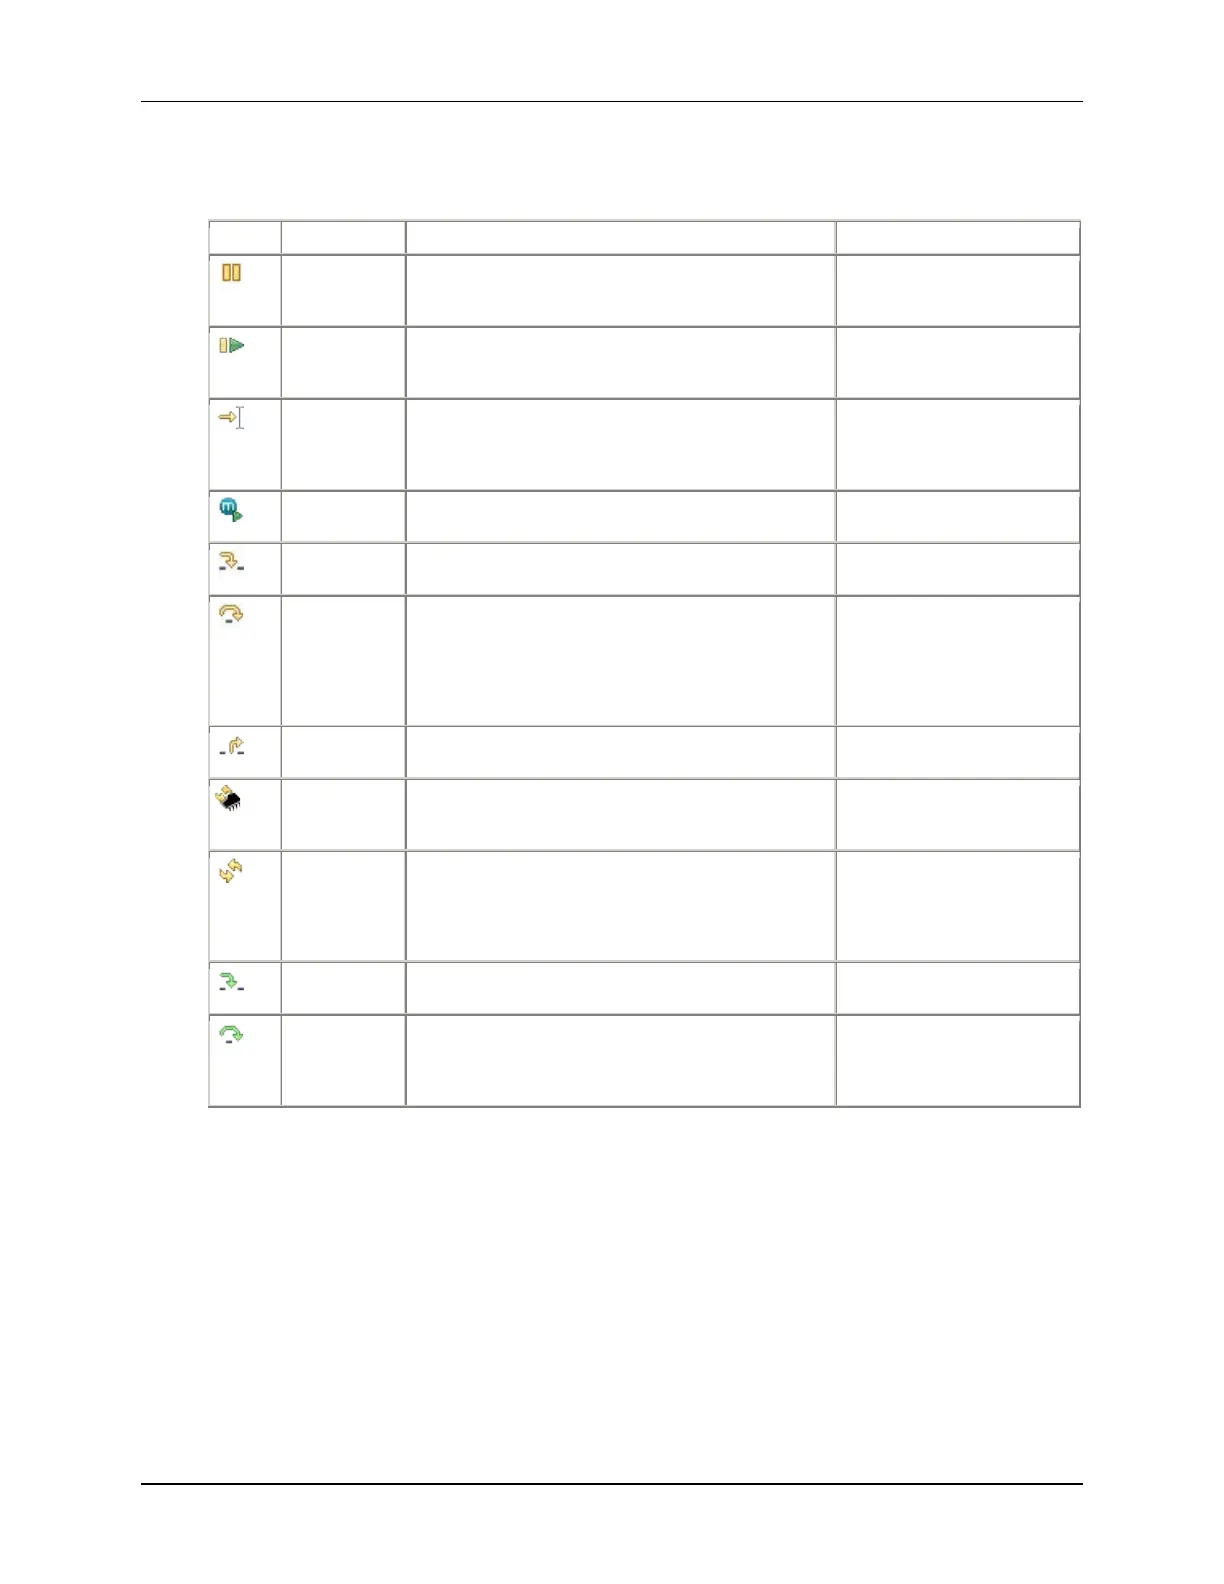
Program execution
Halts the selected target. The rest of the debug
views will update automatically with most recent
Target Menu
Debug View Toolbar
Resumes the execution of the currently loaded
program from the current PC location. Execution
continues until a breakpoint is encountered.
Target Menu
Debug View Toolbar
Resumes the execution of the currently loaded
program from the current PC location. Execution
continues until the specific source/assembly line is
Target Menu
Disassembly Context Menu
Source Editor Context Menu
Runs the programs until the beginning of function
main in reached.
Debug View Toolbar
Steps into the highlighted statement.
Target Menu
Debug View Toolbar
Steps over the highlighted statement. Execution
will continue at the next line either in the same
method or (if you are at the end of a method) it
will continue in the method from which the current
method was called. The cursor jumps to the decla-
ration of the method and selects this line.
Target Menu
Debug View Toolbar
Steps out of the current method.
Target Menu
Debug View Toolbar
Resets the selected target. The drop-down menu
has various advanced reset options, depending on
Target Menu
Debug View Toolbar
Restores the PC to the entry point for the currently
loaded program. If the debugger option "Run to
main on target load or restart" is set the target will
run to the specified symbol, otherwise the execu-
tion state of the target is not changed.
Target Menu
Debug View Toolbar
The debugger executes the next assembly instruc-
tion, whether source is available or not.
TI Explicit Stepping Toolbar
Target Advanced Menu
Step Over
The debugger steps over a single assembly instruc-
tion. If the instruction is an assembly subroutine,
the debugger executes the assembly subroutine
and then halts after the assembly function returns.
TI Explicit Stepping Toolbar
Target Advanced Menu
 Loading...