Step-by-Step Guide to your own Linux Application • 125
Debugging of User Space Programs
WAGO-I/O-SYSTEM 750
Linux Fieldbus Coupler
5.12.6 Debugging via the Graphical Interface DDD
To debug via the graphical interface, you must first install a graphical front
end for command line debuggers on the PC. In this example it is DDD. See
also section 5.12.2.
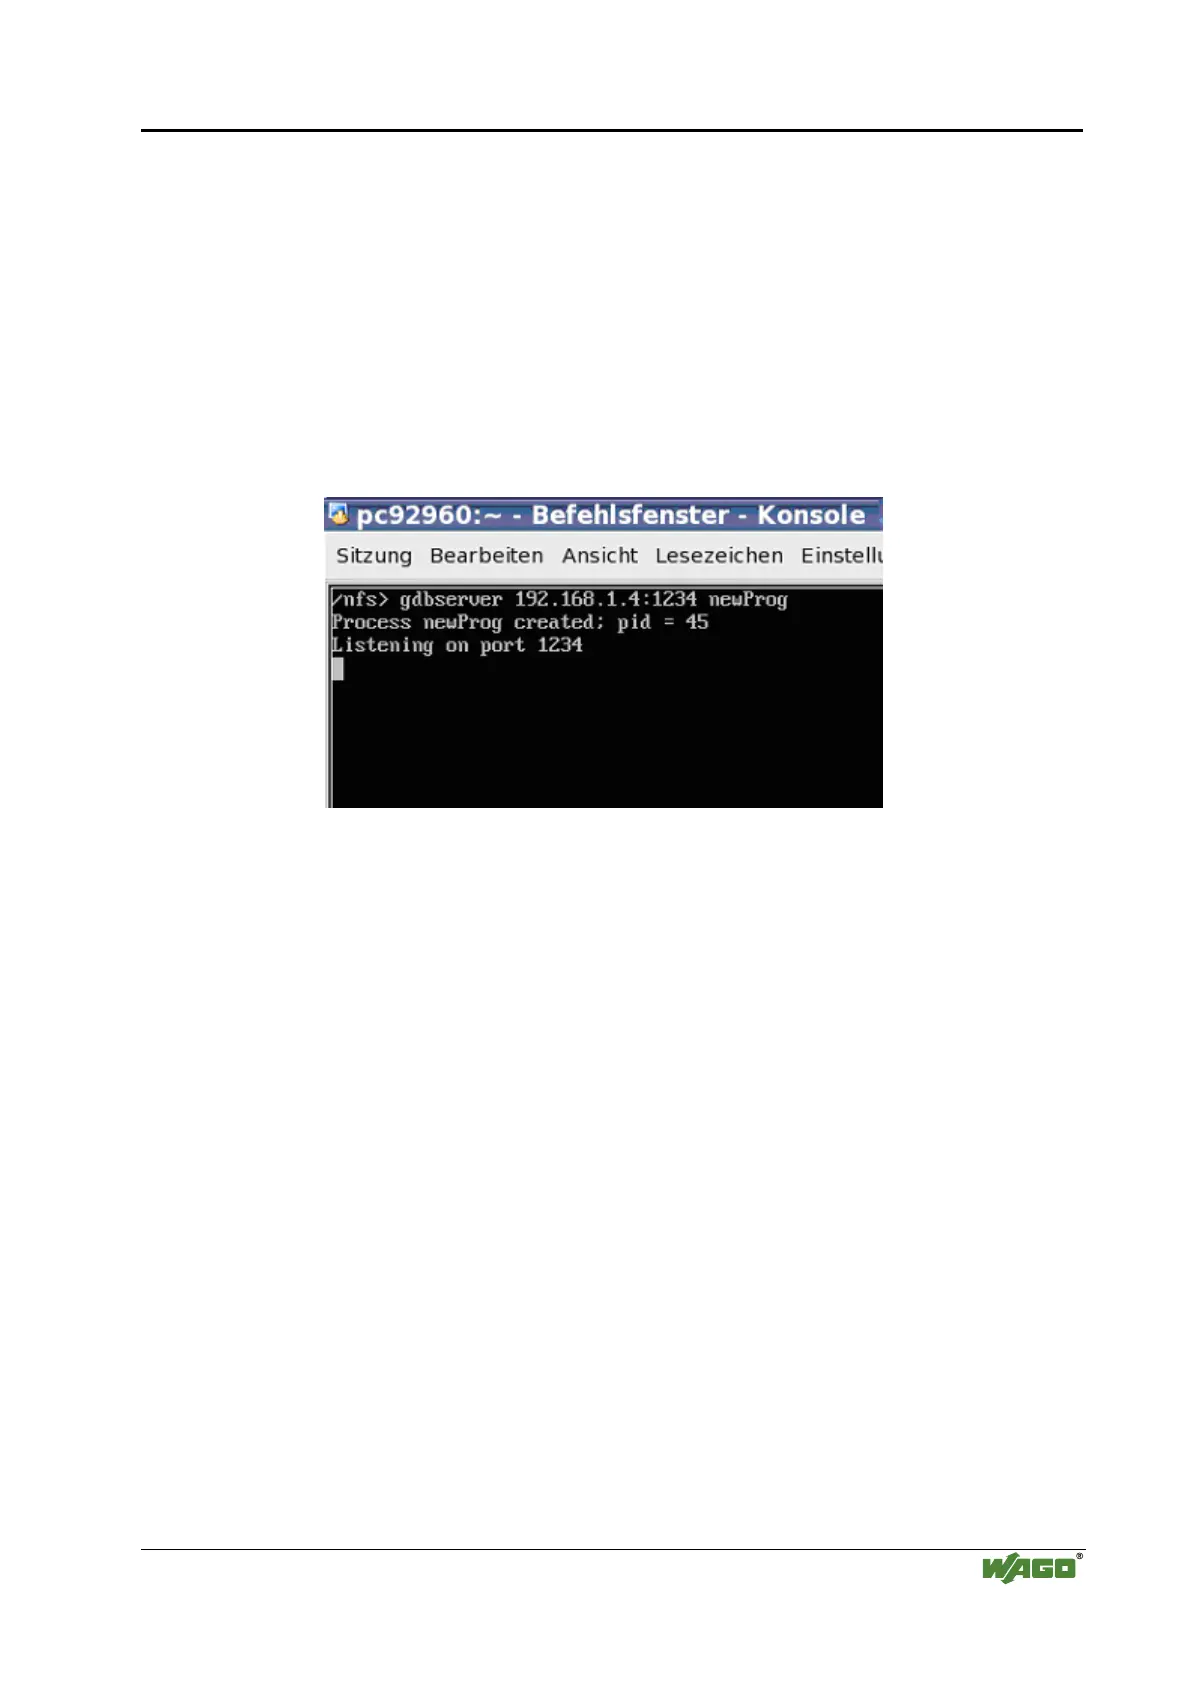
Like debugging via GDB, it is necessary to start the GDB server on the Linux
fieldbus controller. To do so, change the directory in which the program that
has been created. To start the GDB server, enter the following calls into the
console:
> gdbserver 192.168.1.4:1234 newProg
Fig. 5-8: Starting the GDB server on the 750-860
The GDB server will now wait for a connection request via port 1234 of IP
address 192.168.1.4.
The graphical interface DDD and the debugger GDB will be started on the
Linux PC when you enter the following calls into the console:
> cd ~/uclinux-dist/user/newProg
> ddd newProg.gdb --command=gdb.script
--degugger arm-uclinux-elf-gdb --gdb

 Loading...