7-34 Agilent 4155B/4156B User’s Guide Vol.2, Edition 5
Data Variable and Analysis Function
Analysis Function
Marker on the GRAPH/LIST: GRAPHICS screen
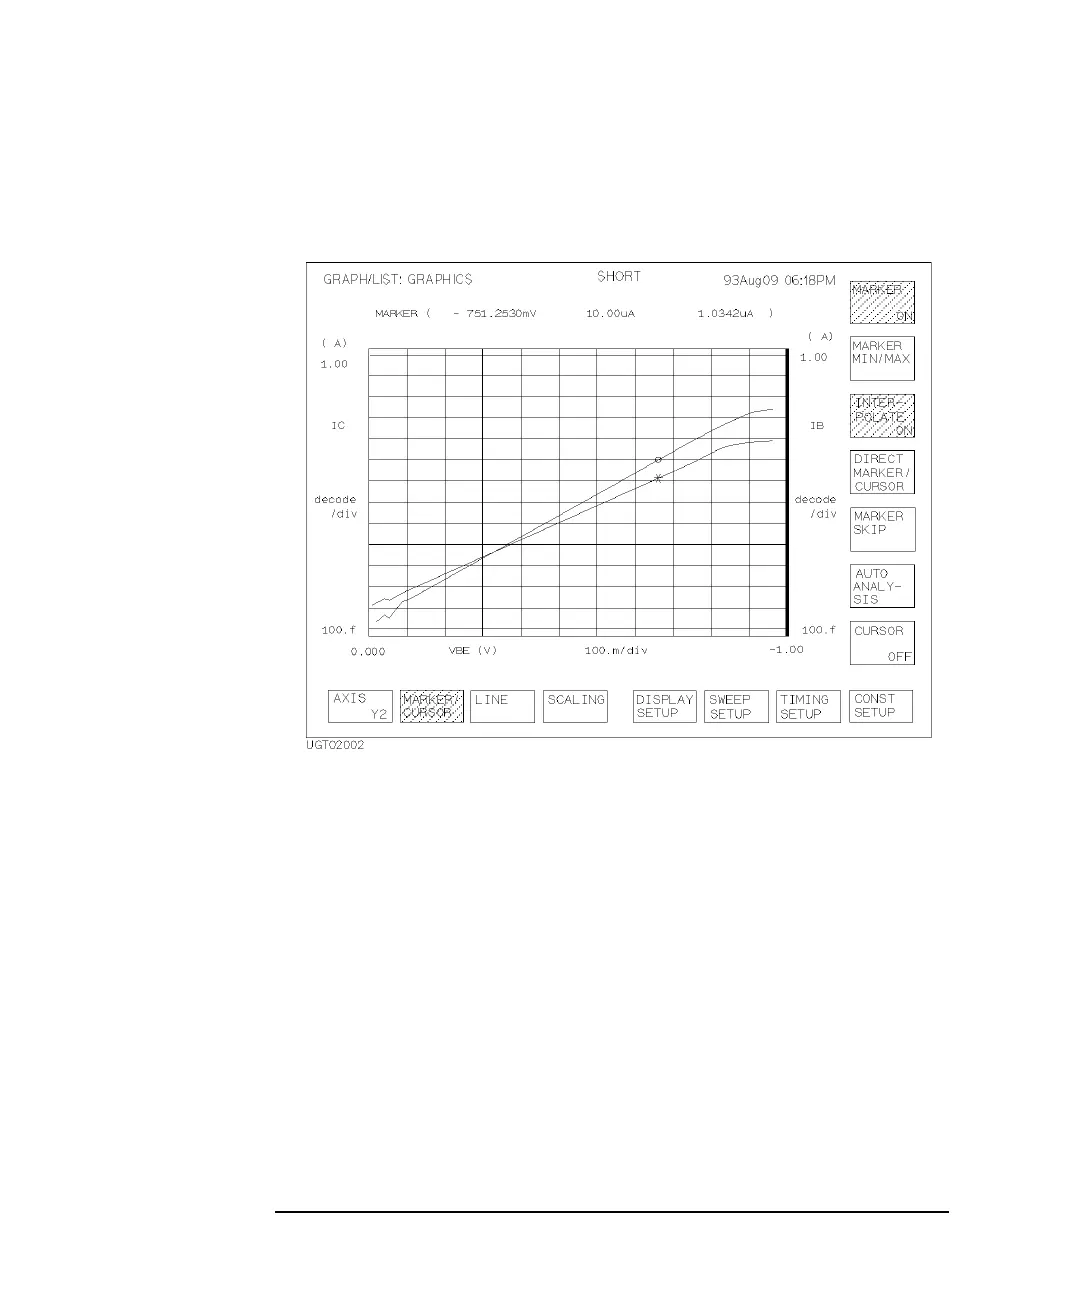
Figure 7-3 Markers on the GRAPH/LIST: GRAPHICS screen
You can display the markers on the plotted measurement curves on the
GRAPH/LIST: GRAPHICS screen by selecting MARKER/CURSOR primary
softkey, then selecting MARKER secondary softkey. The marker for Y1 axis is a
circle (o), and the marker for Y2 axis is an asterisk (*). The active marker depends
on the selected axis.
Markers have the following functions on the GRAPH/LIST: GRAPHICS screen:
• displaying values of measurement curve.
The X, Y1, or Y2 coordinate values at the marker location are displayed.
• specifying a point at which to draw a tangent line
For tangent line mode, the marker is used to specify the position at which to
draw a tangent to the measurement curve. Refer to “Line Drawing” on page
7-39.
• displaying values of data variables