Working with Application Graphs Applications
Agilent 8163A/B, 8164A/B & 8166A/B Mainframes, Sixth Edition 237
How to Select the Samples Display
The samples display determines how the curves of the graph are
represented. To choose the samples display:
1 Press the [Menu] softkey and move to <Samples Display>. A box displaying the
following options appears:
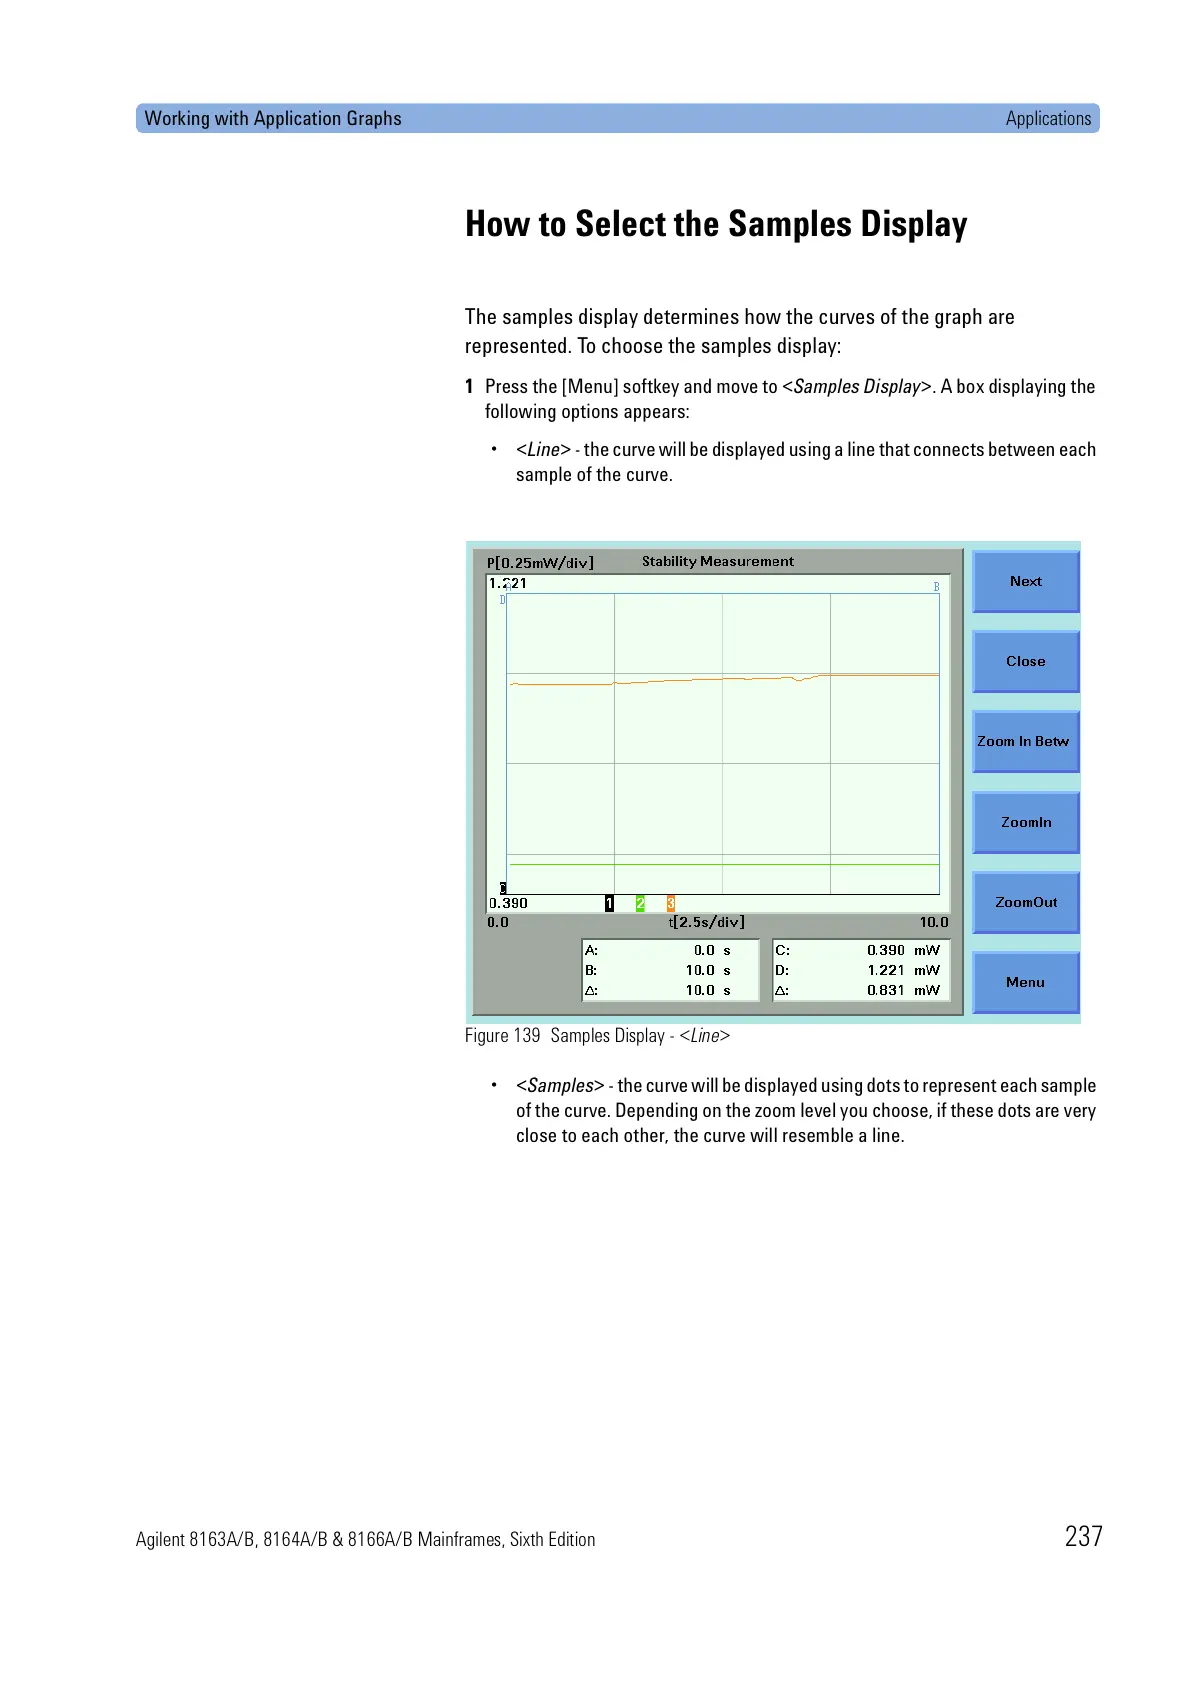
•<Line> - the curve will be displayed using a line that connects between each
sample of the curve.
Figure 139 Samples Display - <Line>
•<Samples> - the curve will be displayed using dots to represent each sample
of the curve. Depending on the zoom level you choose, if these dots are very
close to each other, the curve will resemble a line.
 Loading...


