Chapter 4 — Spectrum Analyzer 4-16 In-Band Spurious Measurement
MS20xxA VNA Master UG 10580-00166 Rev. C 4-15
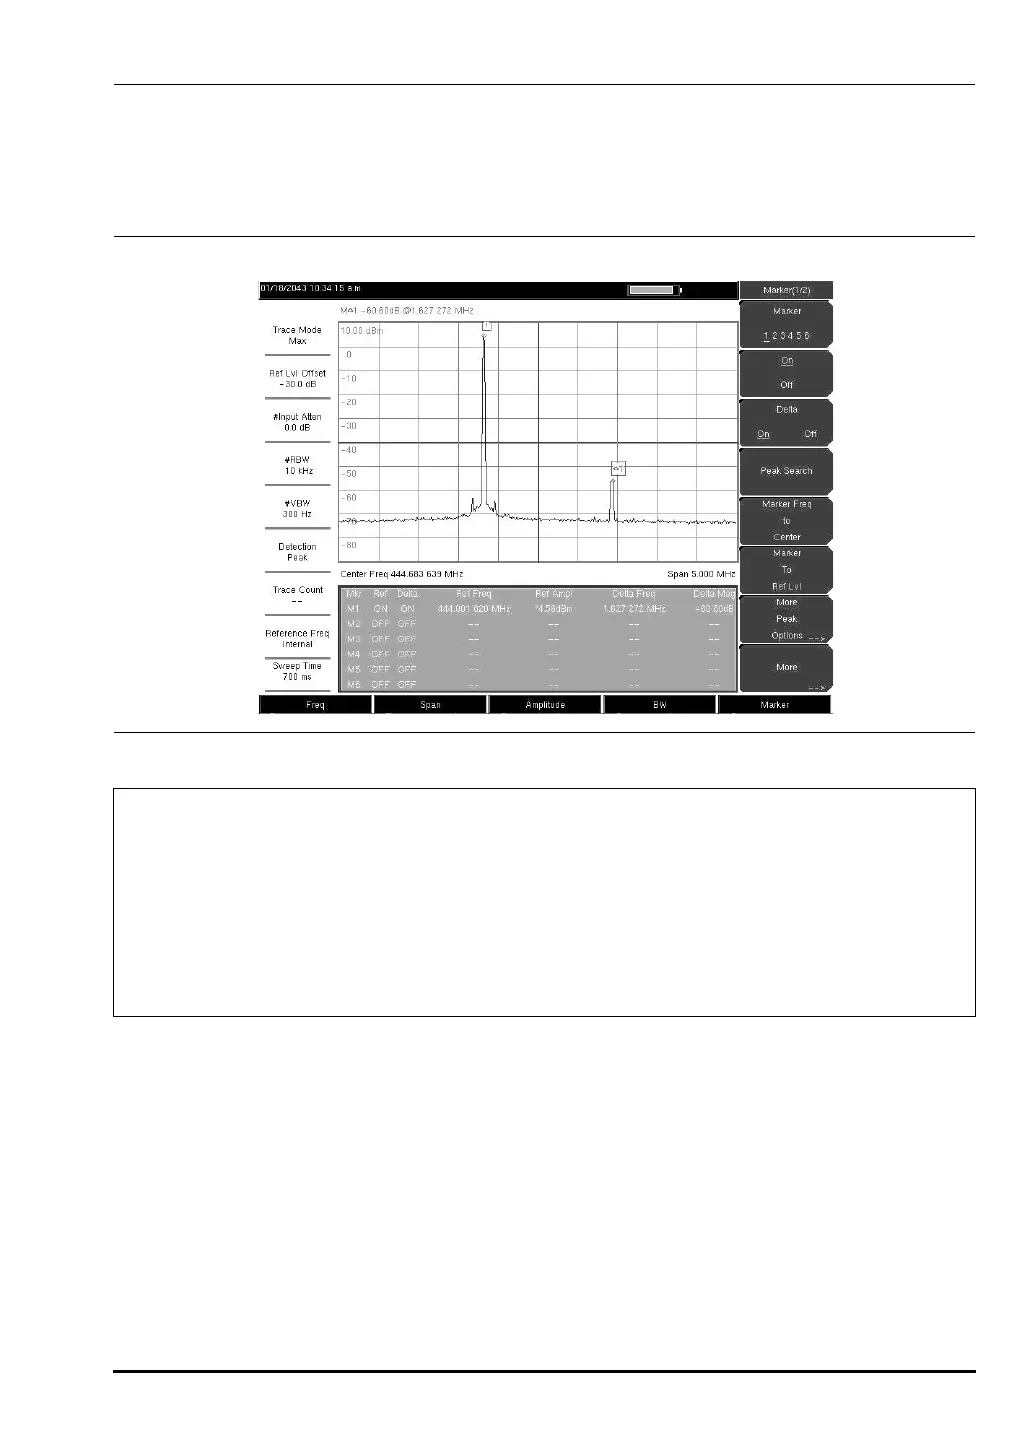
Figure 4-5 shows a simulated in-band spur at 1.627272 MHz from the carrier frequency (f
c
) of
444.001820 MHz and is measured by M1. The delta marker on M1 shows the signal at
f
c
+ 1.627272 MHz to be 60.60 dB down from the carrier. These values should be compared
against the specification for the transmitter being tested.
Figure 4-5. In-band Spurious Measurement
Note
The resolution bandwidth of a spectrum analyzer is determined by the
intermediate frequency (IF) filter bandwidth. The MS203xA traces the shape of the
IF filter as it sweeps past a signal.
Therefore, if two equal amplitude signals are very close to each other, the
measurement result can appear to be one single response because the IF or
resolution bandwidth is not small enough to resolve the two signals.
Similarly, if two signals are not equal in amplitude but are very close together, the
smaller signal may not be seen because it is hidden under the large response.
10580-00166C.book Page 15 Thursday, February 21, 2008 12:52 PM







 To Next Page