xStack® DGS-3120 Series Layer 3 Managed Gigabit Ethernet Switch Web UI Reference Guide
448
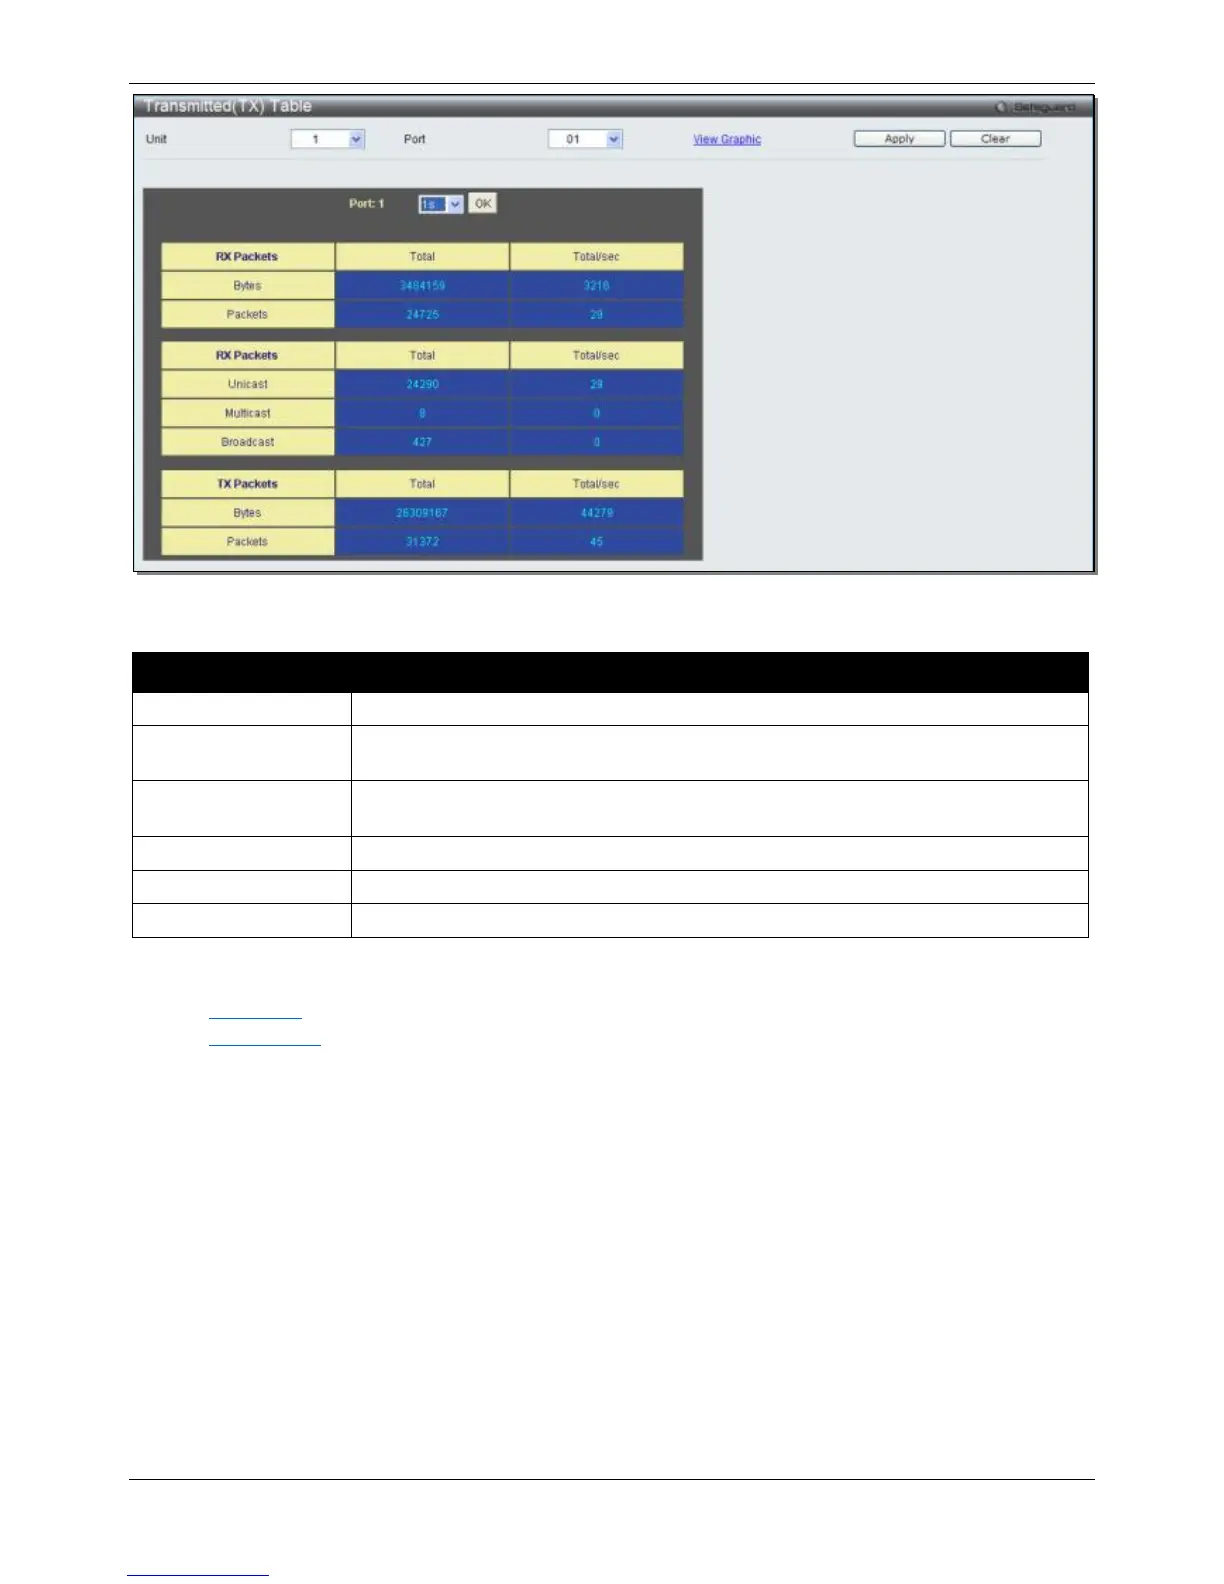
Figure 11-9 TX Packets Analysis window (table for Bytes and Packets)
The fields that can be configured or displayed are described below:
Parameter Description
Click the Apply button to accept the changes made for each individual section.
Click the Clear button to clear all statistics counters in this window.
Click the View Table link to display the information in a table rather than a line graph.
Click the View Graphic link to display the information in a line graph rather than a table.
Errors
The Web manager allows port error statistics compiled by the Switch's management agent to be viewed as either a
line graph or a table. Four windows are offered.
Received (RX)
To select a port to view these statistics for, select the port by using the Port drop-down menu. The user may also
use the real-time graphic of the Switch at the top of the web page by simply clicking on a port.
To view this window, click Monitoring > Statistics > Port Statistics > Errors > Received (RX) as shown below:

 Loading...