6-26
Event Plot - RMS, continued
Event plot -rms
function keys
(continued)
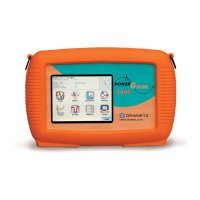
Select Param - allows you to change and select parameters to plot. If you press Select
Param, the Change Parameter/Channel window pops up showing groupings and
arrangements of parameter/channel combinations. You have the option to enable/
disable channels for any of the single or multiple axis plot display. The plot display area
will resize according to the number of parameters/channels enabled/disabled for
display.
NOTE: Event plot retains the present configuration every time it is accessed. The
channel/parameter configuration will reset to default anytime a new monitoring session
starts.
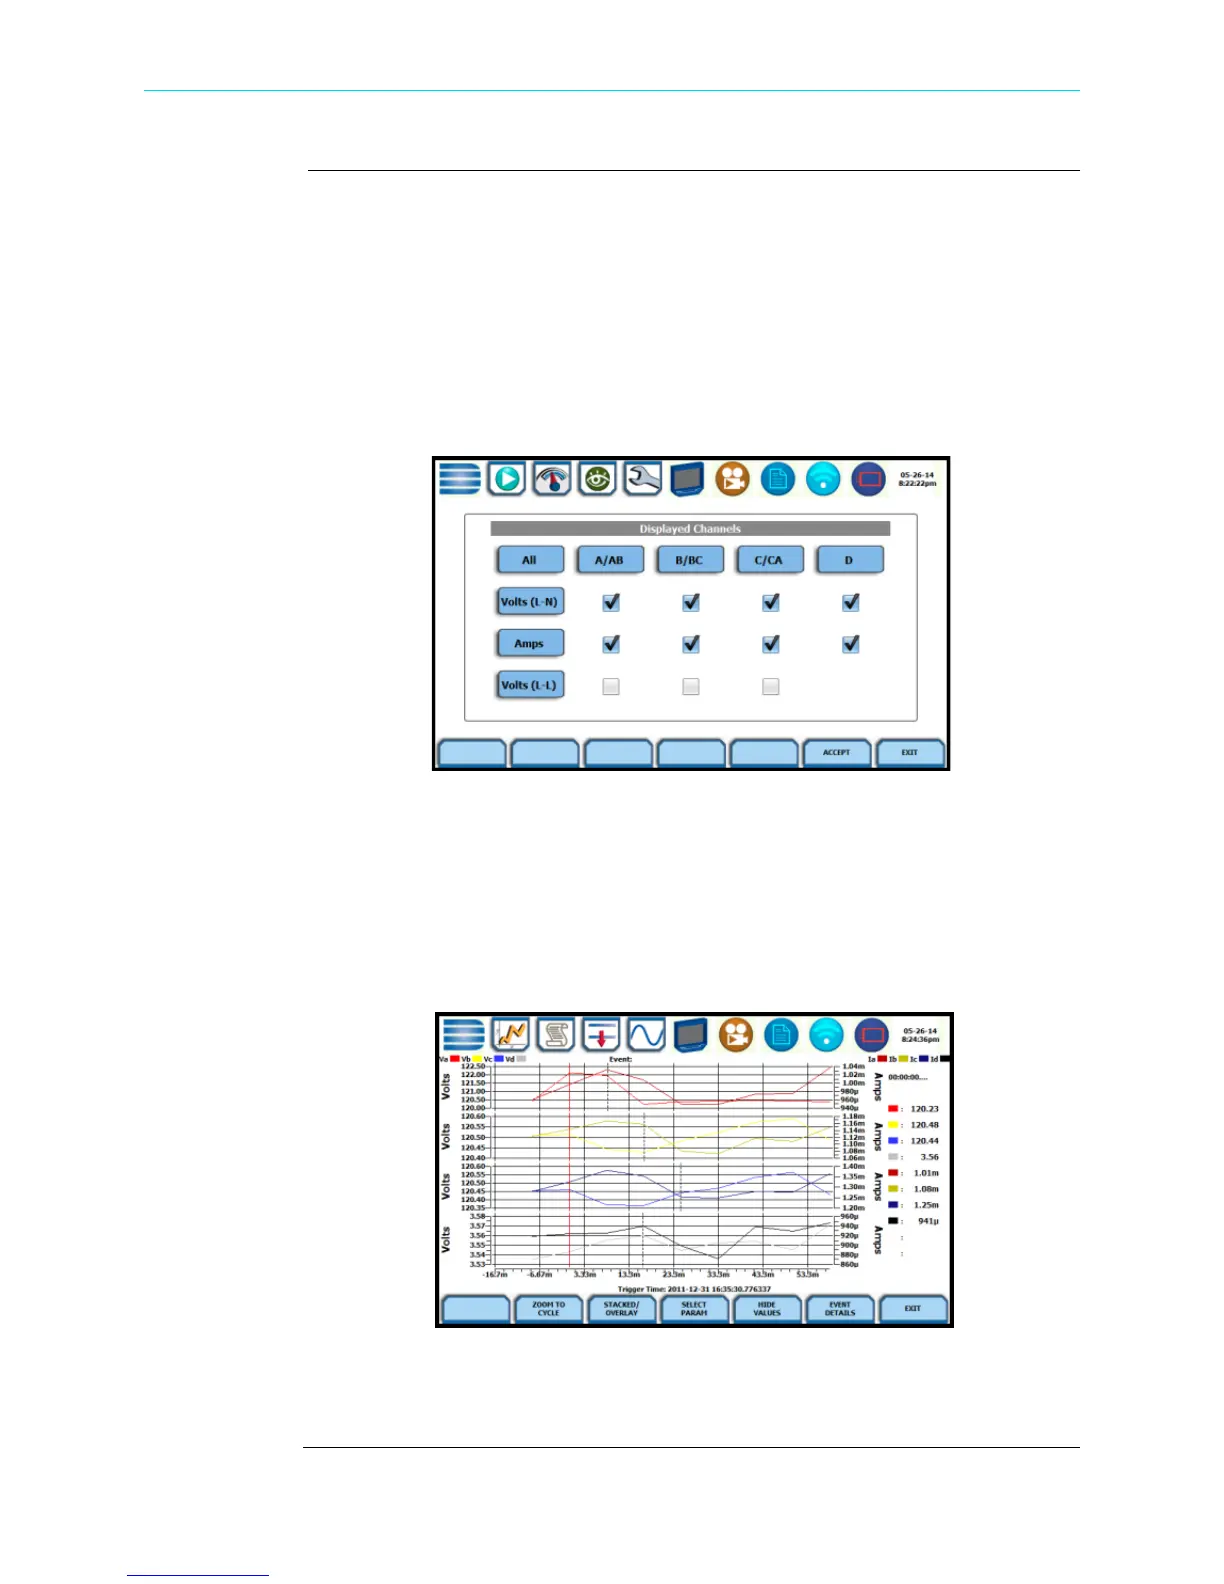
Show Values - splits the screen on the right pane to show values where the vertical
cursor line is displayed. The horizontal black dotted lines indicate the upper and lower
limits that trigger events. The red vertical line indicates the trigger timestamp or start of
event. A dotted vertical black line appears to indicate the new point where the
numerical data values appear on the plot. You can touch and drag the dotted cursor line
onscreen and note how values on the right pane change to show corresponding plot
values. The time range based on which data is plotted appears below the plot display.
The values are identifed by the color coded channel/parameter of captured events on
plot display. This function toggles between hiding/showing the threshold values.
HDPQ-634
HDPQ-635
Shop for Power Metering products online at:
1.877.766.5412
www.PowerMeterStore.com

 Loading...