35
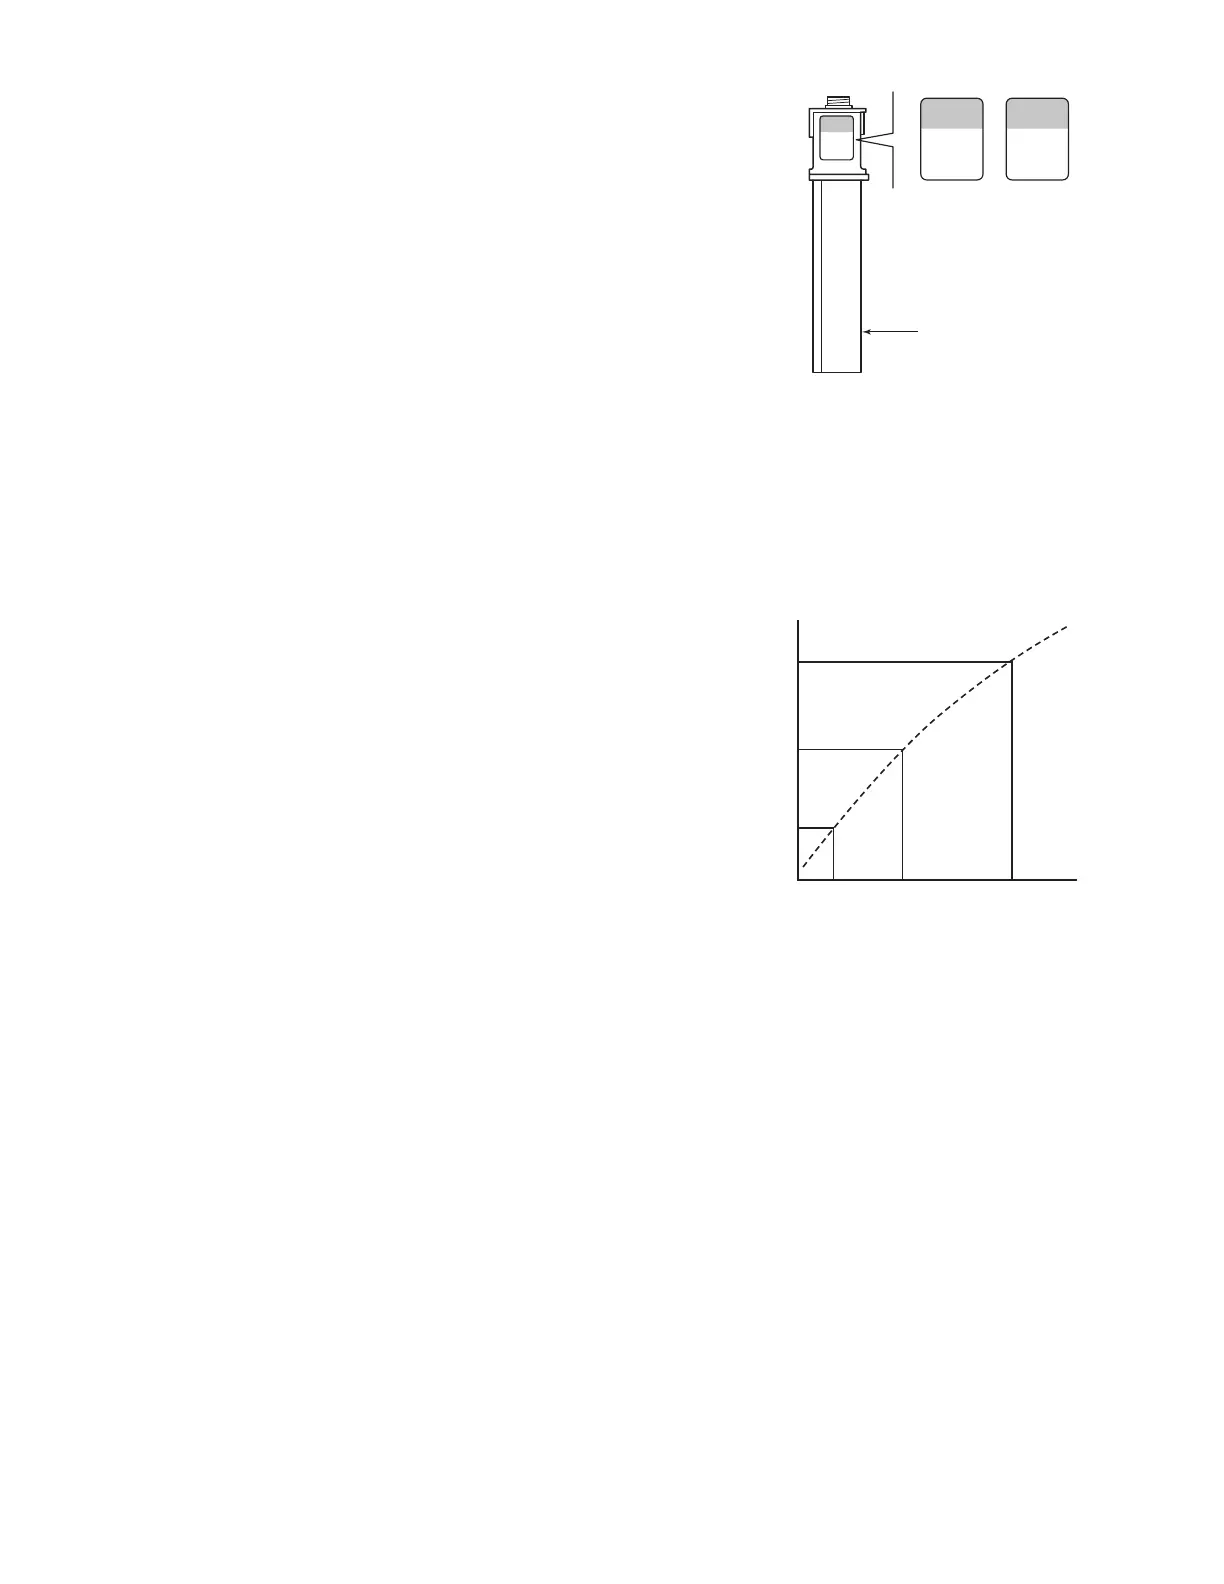
0.5 ml
0.5 ml
1.5ml
Sample rack
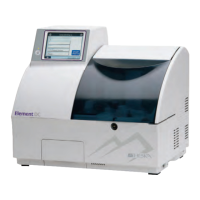
X
y
3
y
2
y
y
1
1
x
1
x
2
x
3
Y
値
準
基
液
準
標
Reference liquid standard value Y
before compensation) X
X
Actual measurement values of slide
1. The relationship between the actual measurement values X (x1,
x2, x3) and the standard values Y (y1, y2, y3) is expressed by the
formula Y=c+dX+eX2. The lot compensation coefficients (c, d,
and e) derived from the formula are used to compensate for
variations in X of each lot.
2. Inputting lot compensation coefficients using a QC card
The lot compensation coefficients are recorded on QC cards,
and one QC card is packed with each box of slides. When data is
input from a new card, the previously stored lot compensation
coefficients are updated. Always read the new QC card when
you switch to a new box of slides, because each QC card also
contains slide data essential for measurement, in addition to the
lot compensation coefficients.
NOTE: The “e” values recorded on the QC cards are expressed as
e×103.
NOTE: The analyzer records the QC card information of up to 5
lots for each test. Reading QC cards of more than 5 lots results in
deletion of QC information starting from the oldest.
3. Using QC cards.
A QC card must be read when a new test slide will be used or
when changing to a new lot of slides.
Read the QC card while [Ready to test] or [Warming up] is
displayed on the LCD.
3.8.3 Sample racks
A sample rack is specified for each sample tube. Place each
sample tube into the specified sample rack.
3.9 QC Card System
Overview
The QC card system compensates for variations between lots of DRI-CHEM slides and ensures uniform performance.
3.9.1 Calculation method
A variety of the reference fluids developed for DRI-CHEM slides are measured on each lot of slides.