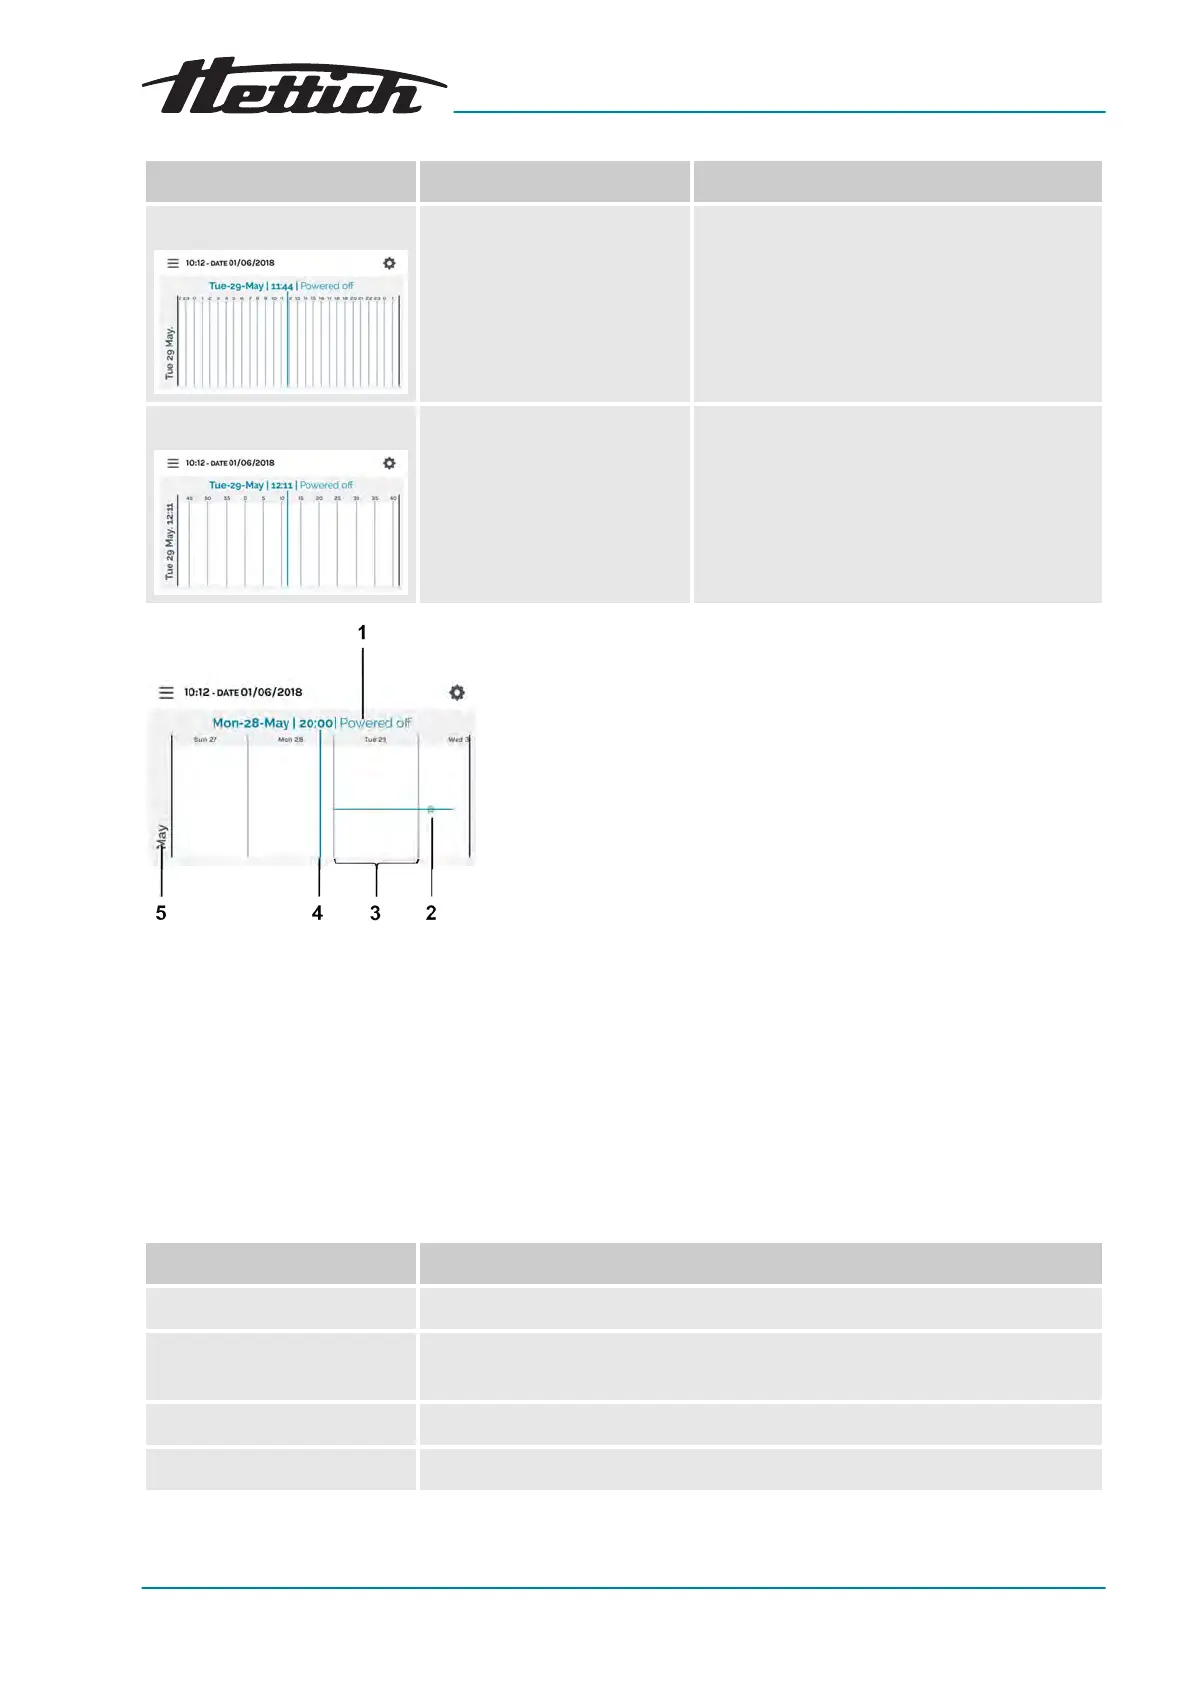
Fig. 59: Scale, level 1 (example)
1 Displayed values at the position of
the display bar (4)
2
Symbol example
‘Events’
on page 53
3 Scale, 1 day
4 Display bar, current display values
(1).
5 Month
Level (type number) Scale Displayed time period
Level 2 (type 2x)
One hour 24 hours are displayed. One can scroll over
seven days.
Level 3 (type 3x) Five minutes 60 seconds are displayed. One can scroll
over twelve hours.
The display can be scrolled horizontally to the left and right. The dot
on the display bar (4) shows the curr
ent position on the scale. Date,
time and temperature of this time are displayed (1).
If the display bar hits an event, the event is displayed in the display
values (1) in plain text.
Events
Symbol Meaning
Black dot Door was opened or closed.
Red dot
An error occurred. The errors can be found in
Chapter 6.13.16 ‘Logbook’
on page 114
.
‘Pause’
symbol Program was paused.
‘Resume program’
symbol Program was continued.