Increasing Measurement Accuracy
and Time-Interval Measurement
Increasing Measurement Accuracy
Measurement statistics in the instrument give valuable insight. Toview
statistics, select the Dene Measure menu. The Statistics softkey allows you
to display either the minimum and maximum or the mean and standard
deviation of all selected measurements. The most recent value is always
displayed.
You need to know how much the instrument's time-interval measurement
varies statistically because this aects measurements of the statistical
behavior of your system. Jitter introduced by the instrument has two
components: a xed part and a variable part. The xed component of jitter
is the same at all points on the time base, including the trigger point. The
variable component increases as the delay from the trigger point increases.
T
o
view
the
xed
part
of
the
jitter
,
set
the
Position
control in
the Time
Base
menu
to its
minimum
value
.
Set
the
Reference
control
in
the
Time
Base
menu
to
Center
.
Set
up
the
instrument
to
view
a
fast-rising
edge
from
a
pulse
generator
,
such
as
an
HP
8131A.
The
triggered
edge
should
be
at
the
center
of
the
screen.
Press
the
Trigger
menu
key
.
Y
ou
will
see
the
trigger
level
marker
displayed
on
the
screen.
Ideally
there
would
be
no
jitter
(no
horizontal spreading
of
the
trace)
where
the
waveform
intersects
the
trigger
level.
Any
spreading is
the
xed
part
of
the
jitter
.
T
o
view
the
variable
part
of
the jitter
,you
must
have
a
synthesized,
crystal-controlled
signal
source
because
the
source
must
have less
jitter
than
the
instrument's
time
base
.
Y
ou
can
use
these
HP
signal
sources
to
characterize
time
base
jitter:
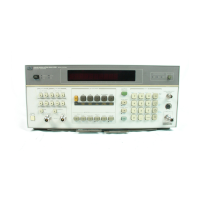
HP
8656B
(see
following
paragraph)
HP 8657A (see following paragraph)
HP 3335A synthesized function generator
HP 80000 pulse/pattern generator
The
faster
the
slew
rate
of
the
source,
the
easier
it
is
to
evaluate
jitter
.
One
way
to
get
fast-slewing
edges
is
to
trigger a
pulse
generator
,
such
as
an
HP
8130A
or
HP 8131A,
with
a
stable
sine-wave
source
,
like
an
HP
8656B
or
HP 8657A.
9-6