78
DISPLAYING THE MEASUREMENT RESULT
When the external printer is set, the displayed analysis
result can be outputted to the external printer. For
details about the external printer, see "
SETTING THE
EXTERNAL PRINTER (EXTERNAL PRINTER)" on
page 134. Output layout of the external printer can be
selected. For details see page 167, SETTING OF
EXTERNAL PRINTER (PRINT EXT).
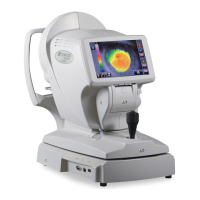
(5) Analysis result Analysis results such as Mire image, Hartmann image and
wavefront aberration image are displayed.
(6) Measurement value data tub
Measurement data is displayed in the order of measurement from
above. The recommended data is displayed with a check mark. A
printer icon and a PC icon are displayed for printed data and out
-
put data respectively.
DESCRIPTION OF MAP LAYOUT
In the measurement result display screen for displaying analysis results, various types of map
layout are prepared and can be selected.
A special toolbar is also prepared. Here, contents of display and features, and the switching
procedure are described.
The following maps are available:
• For Custom map 1-4, layout can be set. See "CUSTOM MAP" on page 142.
• Pupillometry map can be selected under pupillometry mode measuring only.
Multi map
Ocular Aberration map
Corneal Aberration map
Component map
Zernike Vector map
Progress map
IOL Selection map
PSF/MTF map
Pupillometry map
Corneal R/L map
Ocular R/L Map
Custom map 1-4
PRINT