79
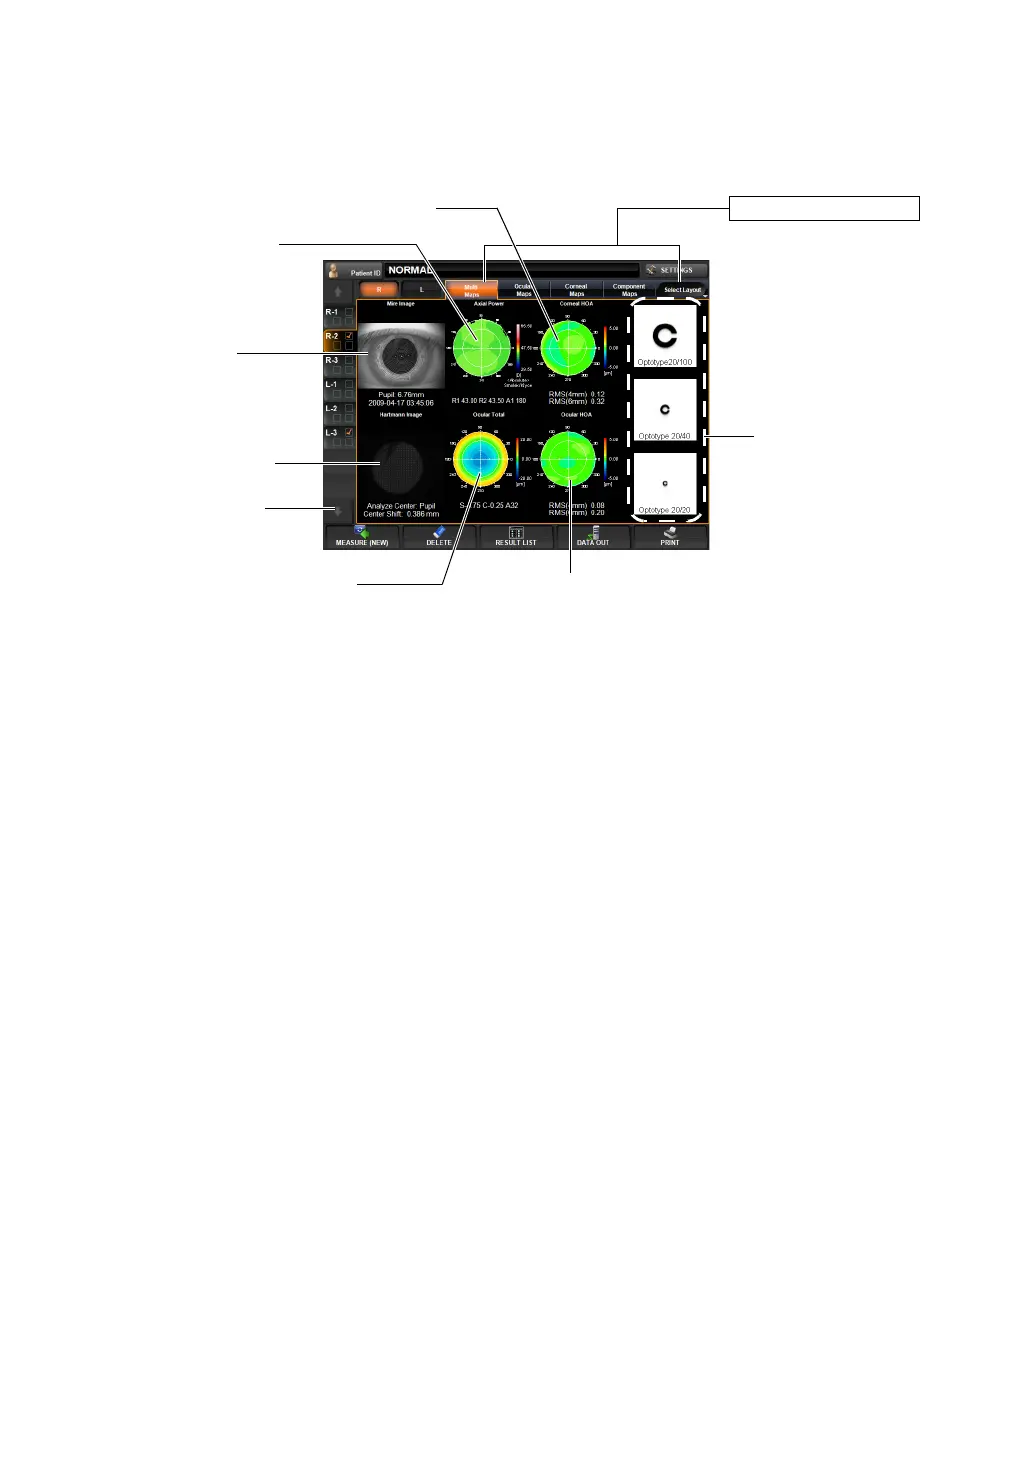
DISPLAYING THE MEASUREMENT RESULT
MULTI MAP DISPLAY
Both Corneal and Ocular aberration maps and Simulation are displayed.
This map display facilitates qualitative comparison of aberration due to corneal topography
and aberration of total refraction.
Changing to other map: Tap the Layout Change button.
Description of Each Display
(1) Mire image Image by projecting a Placido ring to the cornea. An image of corneal
surface; from this image, measurements related to the cornea are
analyzed. The pupil diameter is displayed together with the time and
date of measurement at the bottom part.
(2) Axial Power map A map to display the distribution of corneal refractive power.
KR values are displayed at the bottom part of the map.
(3) Corneal HOA map A map to display corneal higher order aberrations (e.g. irregular
astigma). At the bottom part of the map, corneal higher order aberra
-
tion, 4-mm area and 6-mm area, are displayed with RMS values.
(4) Hartmann image A point image reflected from the internal ocular part through the
pupil. From this image, REF values, ocular total aberration, high
Operation: • When tapped, the image is enlarged. (See "ENLARGEMENT DIS-
PLAY" on page 94.)
• When dragged in the right-left direction, the overlay can be
changed. (See page
98.)
Operation: • When tapped, the map is changed to the cornea aberration map.
(See page
82.)
• The map scale can be changed. (See page 149.)
Operation: • By tapping, the map is switched to the IOL Selection map. (See
page
87.)
• The map display step can be changed. (See "Setting the Display
Step of High Order Aberration Astigma Map" on page
147.)
(6) Ocular HOA map
(7) Simulation
(3) Layout Change button
(5) Ocular Total Aberration map
(1) Mire image
(4) Hartmann image
(8) Analysis center
(2) Axial Power map
(3) Corneal HOA map