87
DISPLAYING THE MEASUREMENT RESULT
(3) Total HOA graph The horizontal axis shows the number of measurements and the ver-
tical axis the value of HOA (High Order Aberration).
The expression at the top right of the graph indicates the approxi-
mated primary line.
R
2
is the determination coefficient showing the degree of applicability
of the approximation.
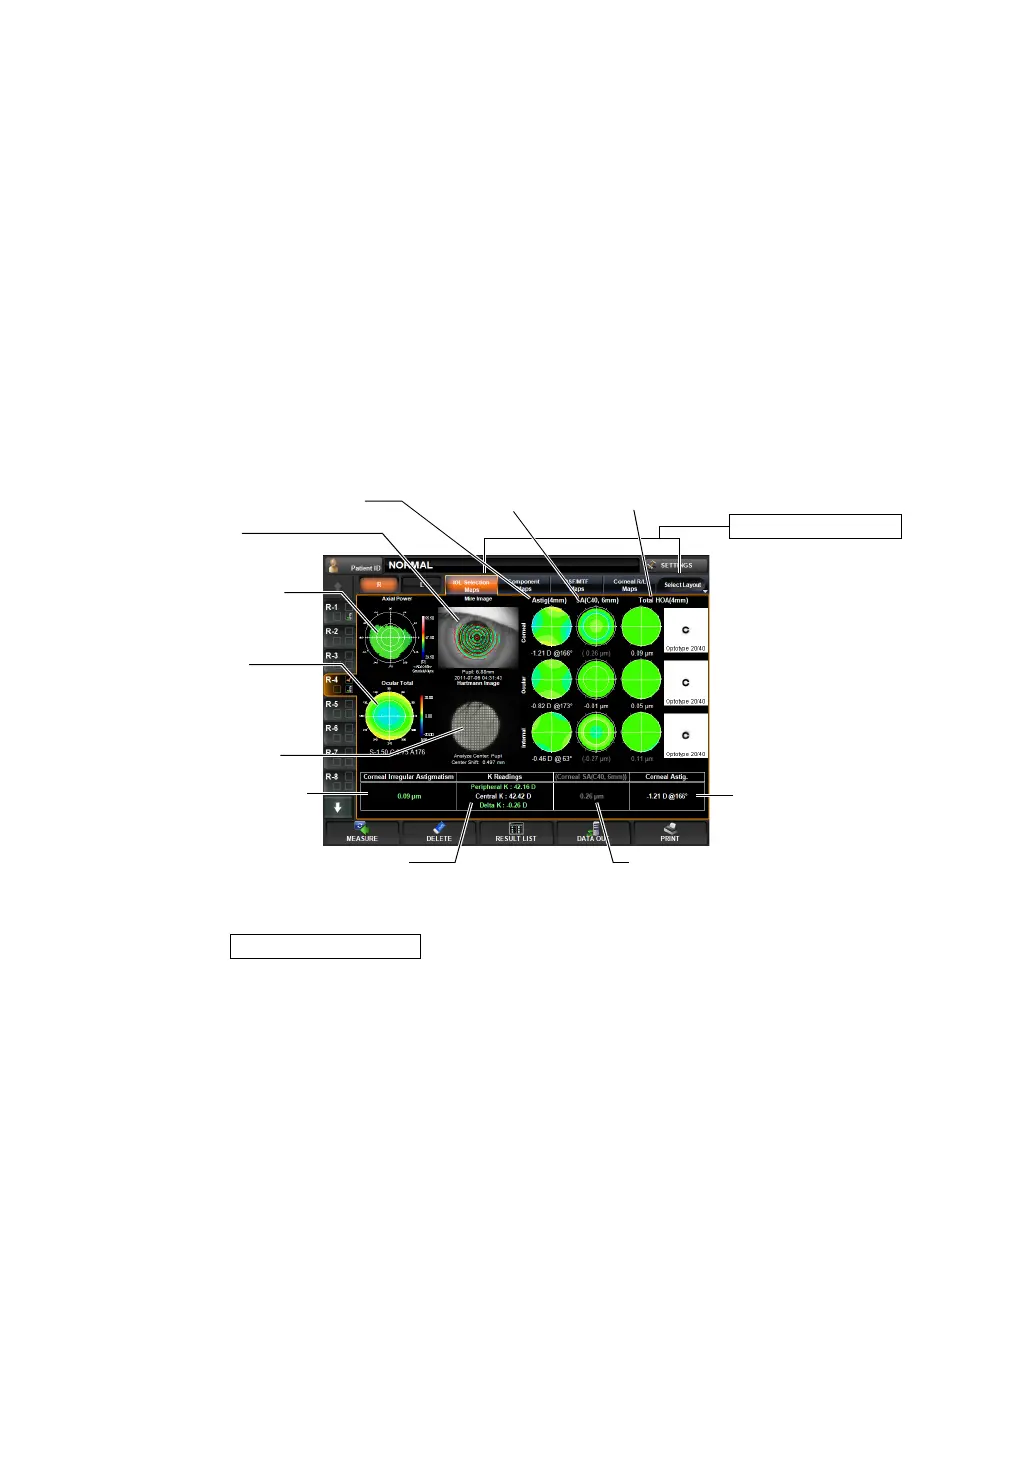
IOL SELECTION MAP
This map displays information useful for the application of IOL after LASIK operation, selec-
tion of K values, spherical IOL and aspheric IOL in determining the power, application of bifo-
cal IOL, etc.
To change display: Tap the Select Layout button (at the rightmost of Layout Change buttons),
and tap the
button from the pull down menu.
To change display to another map: Tap the Layout Change button.
(1) Mire image (See "Mire Image" on page 79.)
(2) Axial Power map (See "Axial Power Map" on page 79.)
• The graph scale can be changed by dragging to the right/left.
• Graph setting can be also set by the item of "DISPLAY" of the
"SETTINGS screen." (See "
PROGRESS MAP GRAPH SCALE" on
page 153.)
Operation: • When tapped, the image is enlarged. (See "ENLARGEMENT DIS-
PLAY" on page 94.)
• When dragged in the right-left direction, the overlay can be
changed. (See page
98.)
Operation: • When tapped, the image is enlarged. (See "ENLARGEMENT DIS-
PLAY" on page 94.)
Layout Change button
(2) Axial Power map
(3) Ocular total
aberration map
(4) Hartmann image
(8) Corneal HOA display
(9) Display of Average K and Central K (10) Display of corneal spherical aberratio
(11) Display of corneal
astigmatic power
(1) Mire image
(5) Astig (4mm) (6) SA display (7) Total HOA display
IOL Selection Map