86
DISPLAYING THE MEASUREMENT RESULT
(3) Ocular HOA map (See "Ocular High Order Aberration Map" on page 80.)
(4) HOA map Aberration of each component (3rd and 4th-order) is displayed.
(5) Simulation Simulation of each component is displayed.
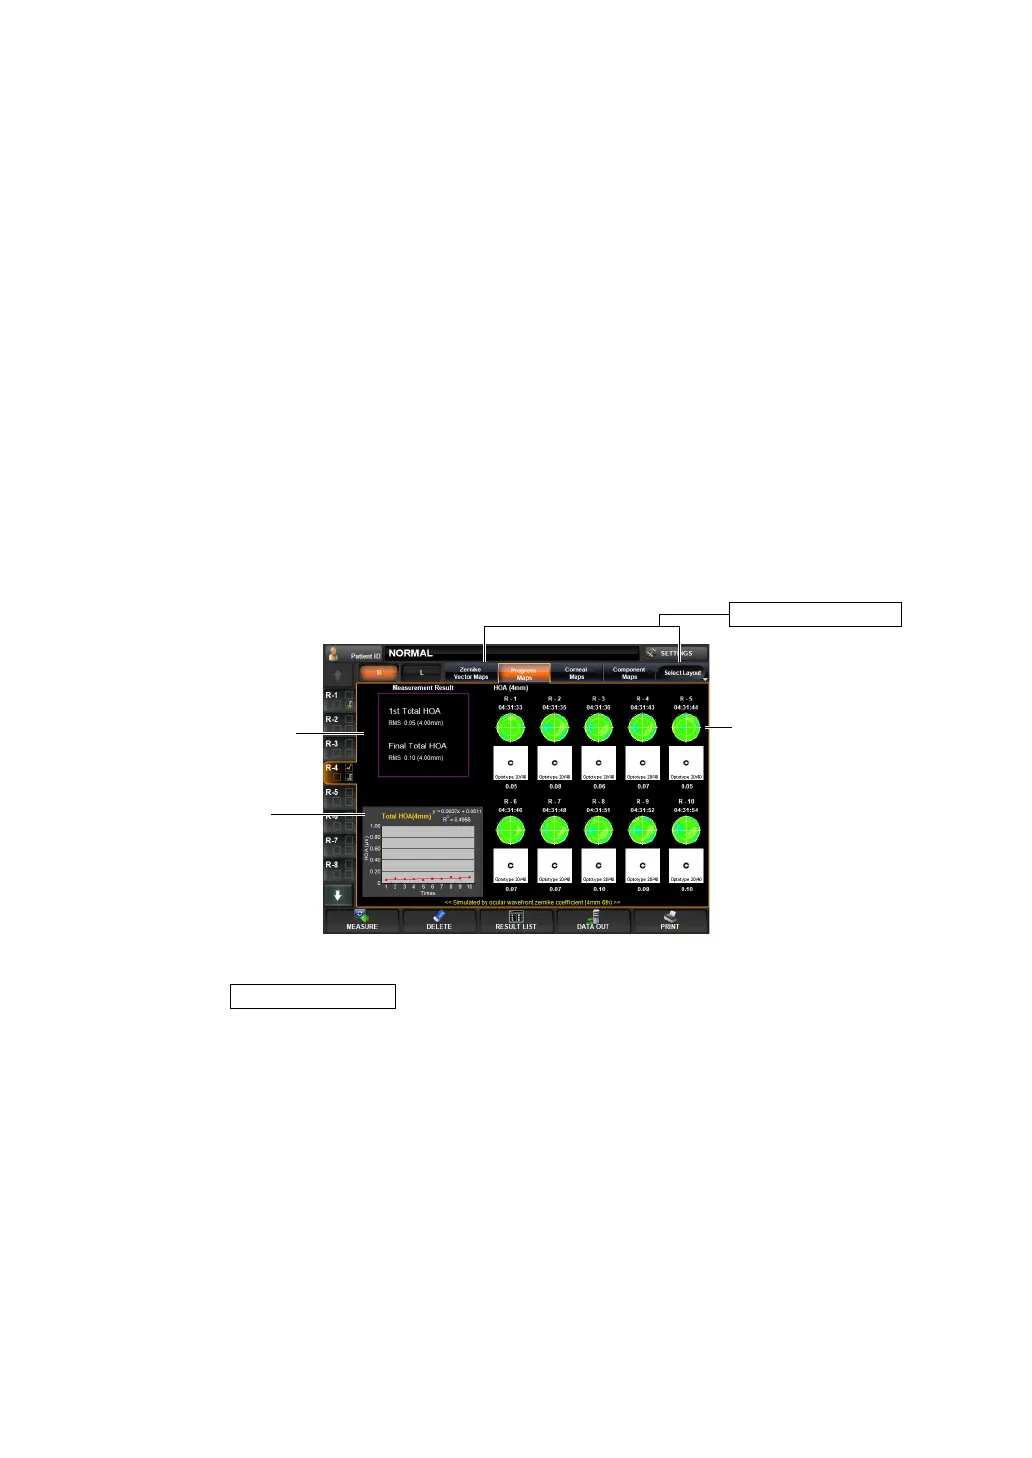
PROGRESS MAP
This map displays higher order aberrations when multiple measurements are done (10 mea-
surements max.)
To change display: Tap the Select Layout button (at the rightmost of Layout Change buttons),
and tap the
button from the pull down menu.
To change display to another map: Tap the Layout Change button.
(1) Ocular HOA map (See "Ocular High Order Aberration Map" on page 80.)
(2) Measurement Result
Values of aberration in the first and last measurements are dis-
played.
Operation: • When tapped, the image is enlarged. (See "ENLARGEMENT DIS-
PLAY" on page 94.)
• The map display step can be changed. (See "SETTING THE HIGH
ORDER ABERRATION ASTIGMA MAP DISPLAY STEP" on page
147.)
Operation: • When tapped, the image is enlarged. (See "ENLARGEMENT DIS-
PLAY" on page 94.)
• The map display step can be changed. (See "SETTING THE HIGH
ORDER ABERRATION ASTIGMA MAP DISPLAY STEP" on page
147.)
Operation: (See "Simulation" on page 82.)
Operation: • When tapped, the image is enlarged. (See "ENLARGEMENT DIS-
PLAY" on page 94.)
• The map display step can be changed. (See "SETTING THE HIGH
ORDER ABERRATION ASTIGMA MAP DISPLAY STEP" on page
147.)
Layout Change button
(2) Measurement Result
(1) Ocular HOA map
(3) Total HOA graph
Progress Map