R3132 Series Spectrum Analyzer Operation Manual
2.3.3 Measuring Adjacent Channel Leakage Power (ACP)
2-66
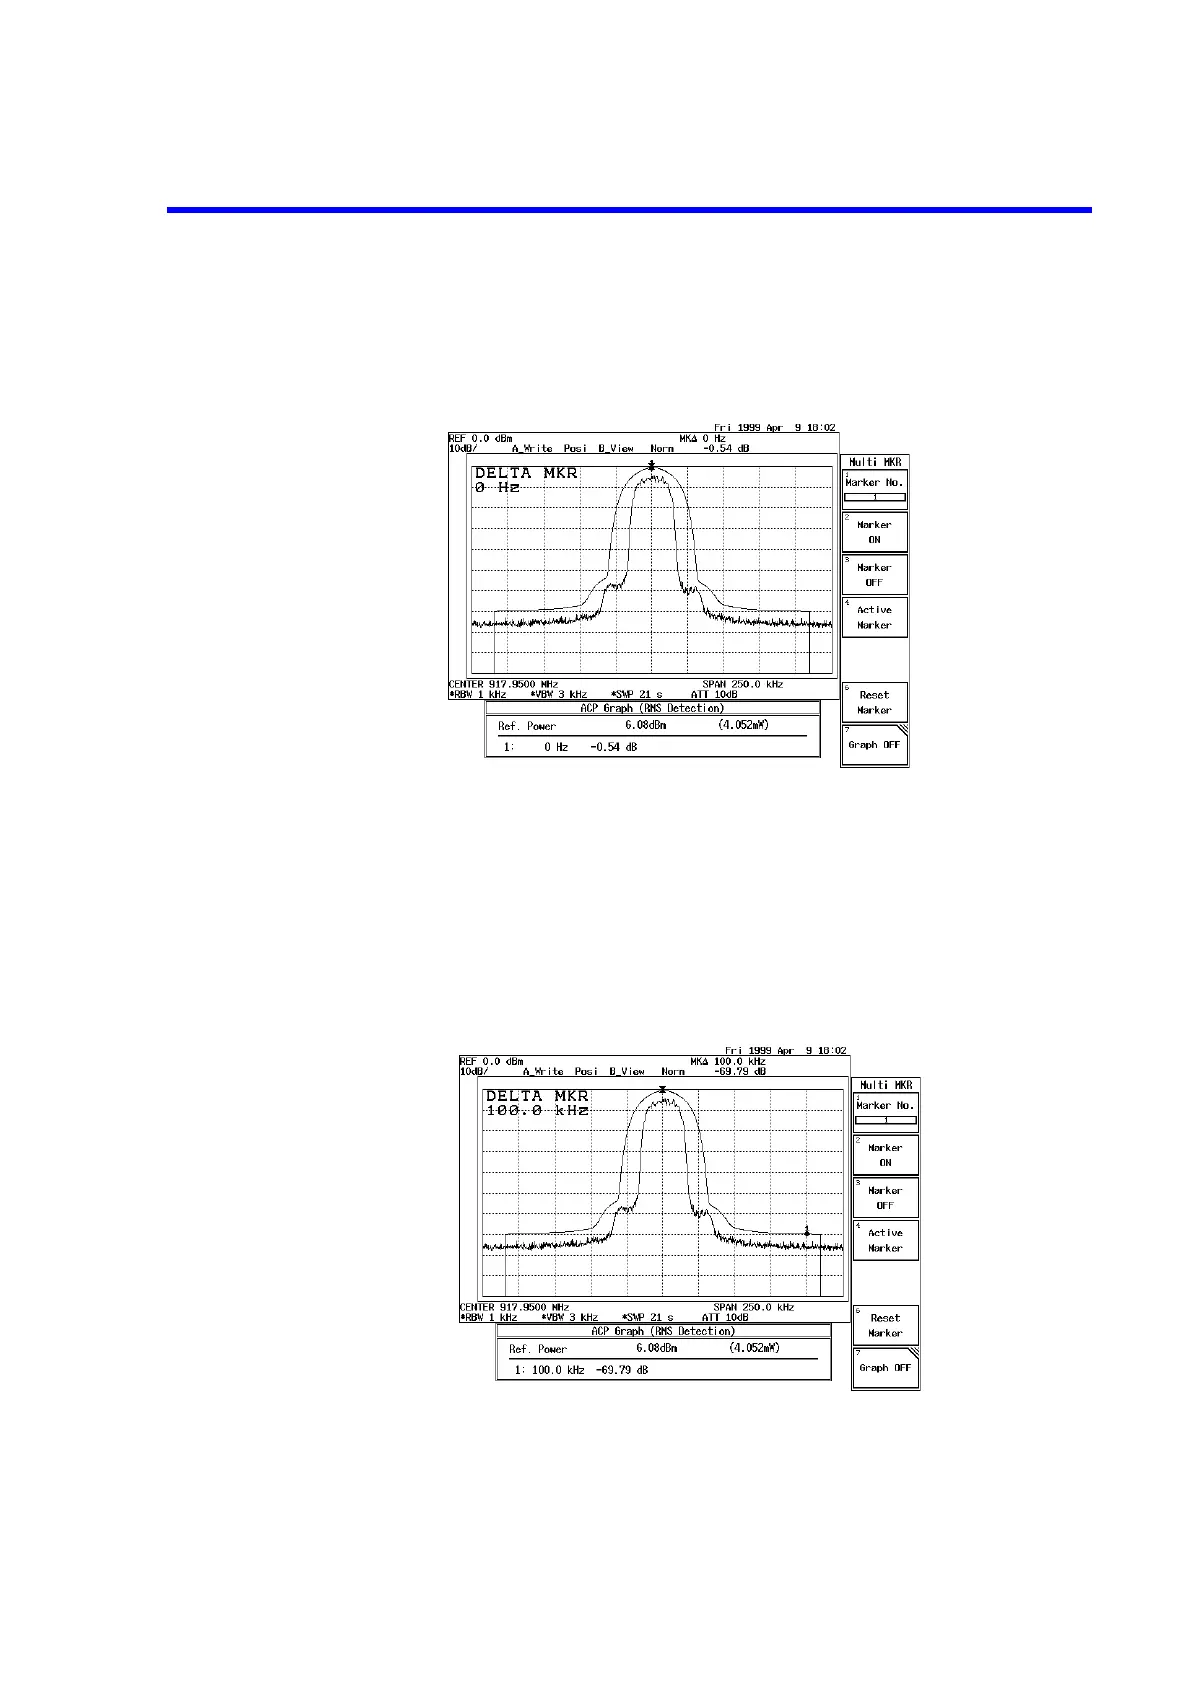
Making observations using ACP GRAPH
24. Press Graph.
The calculation result of the adjacent channel leakage power and the delta marker
are displayed.
Figure 2-60 Measurement Using ACP GRAPH
Specifying measurement points
Moving the marker to another channel.
25. Move the marker to 100 kHz using the data knob.
The adjacent channel leakage power at 100 kHz is displayed in the result area.
Figure 2-61 ACP at the 100 kHz
 Loading...