EasyManua.ls Logo

Agilent Technologies 89410A - Page 103

Agilent Technologies 89410A
339 pages
To Next Page IconTo Next Page
To Previous Page IconTo Previous Page
Loading...
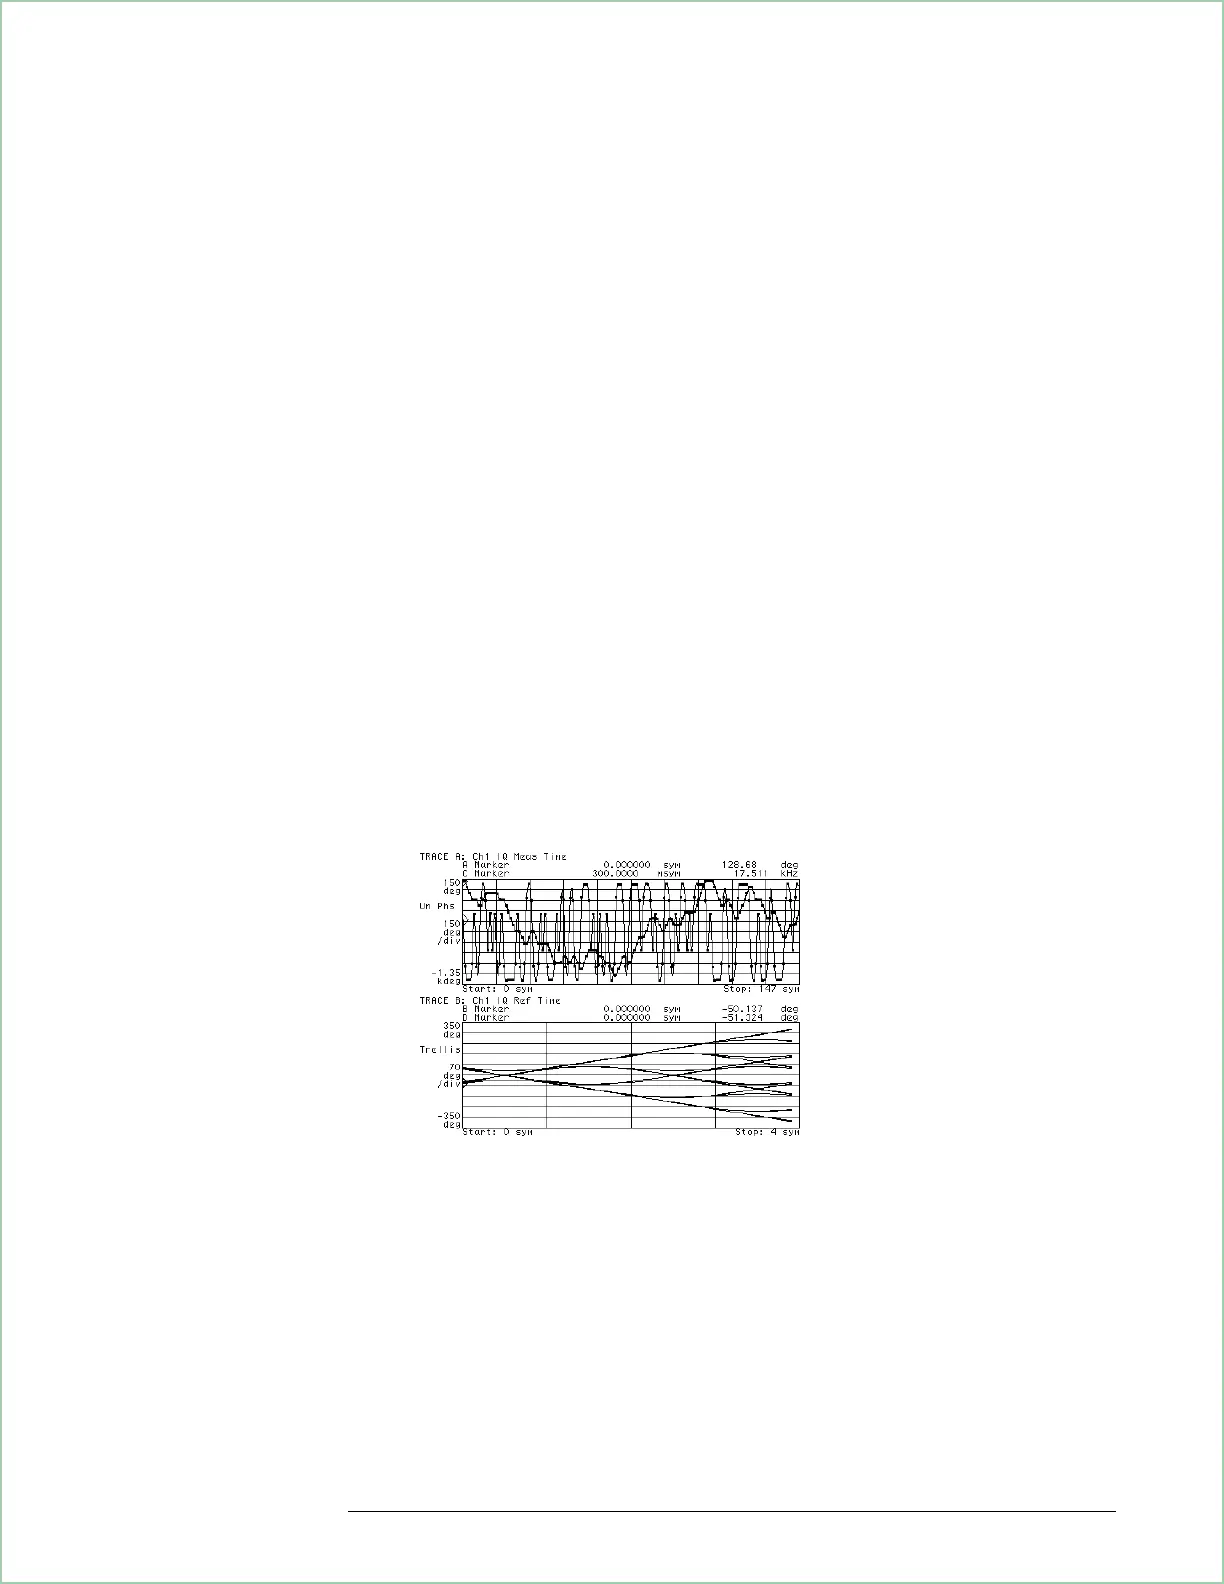
6. Format traces B and D to view the reference versus the measured trellis
diagram:
Press [
Display
], [
2 grids
], [
view/overlay traces
], [
D on
]
Press [
B
], [
Measurement Data
], [
IQ reference time
]
Press [
D
], [
Measurement Data
], [
IQ measured time
]
Press [
Shift
], [
B
]
Press [
Data Format
], [
eye diagram trellis
]
Press [
more format setup
], [
eye length
], 4, [
enter
], [
Auto Scale
]
The upper grid shows the relationship between instantaneous frequency and
instantaneous phase. The trellis diagram in the lower grid presents another view of
phase response.
Using Digital Demodulation (Opt. AYA)
8 - 15

Table of Contents

Other manuals for Agilent Technologies 89410A

Related product manuals