Press [
Instrument Mode
], [
Analog Demodulation
] (with option AYH, press
[
Instrument Mode
], [demod type], [Analog Demodulation], [Return]).
Press [
demodulation setup
], [
ch1 result
], [
FM
].
Press [
Auto Scale
] to scale the display information.
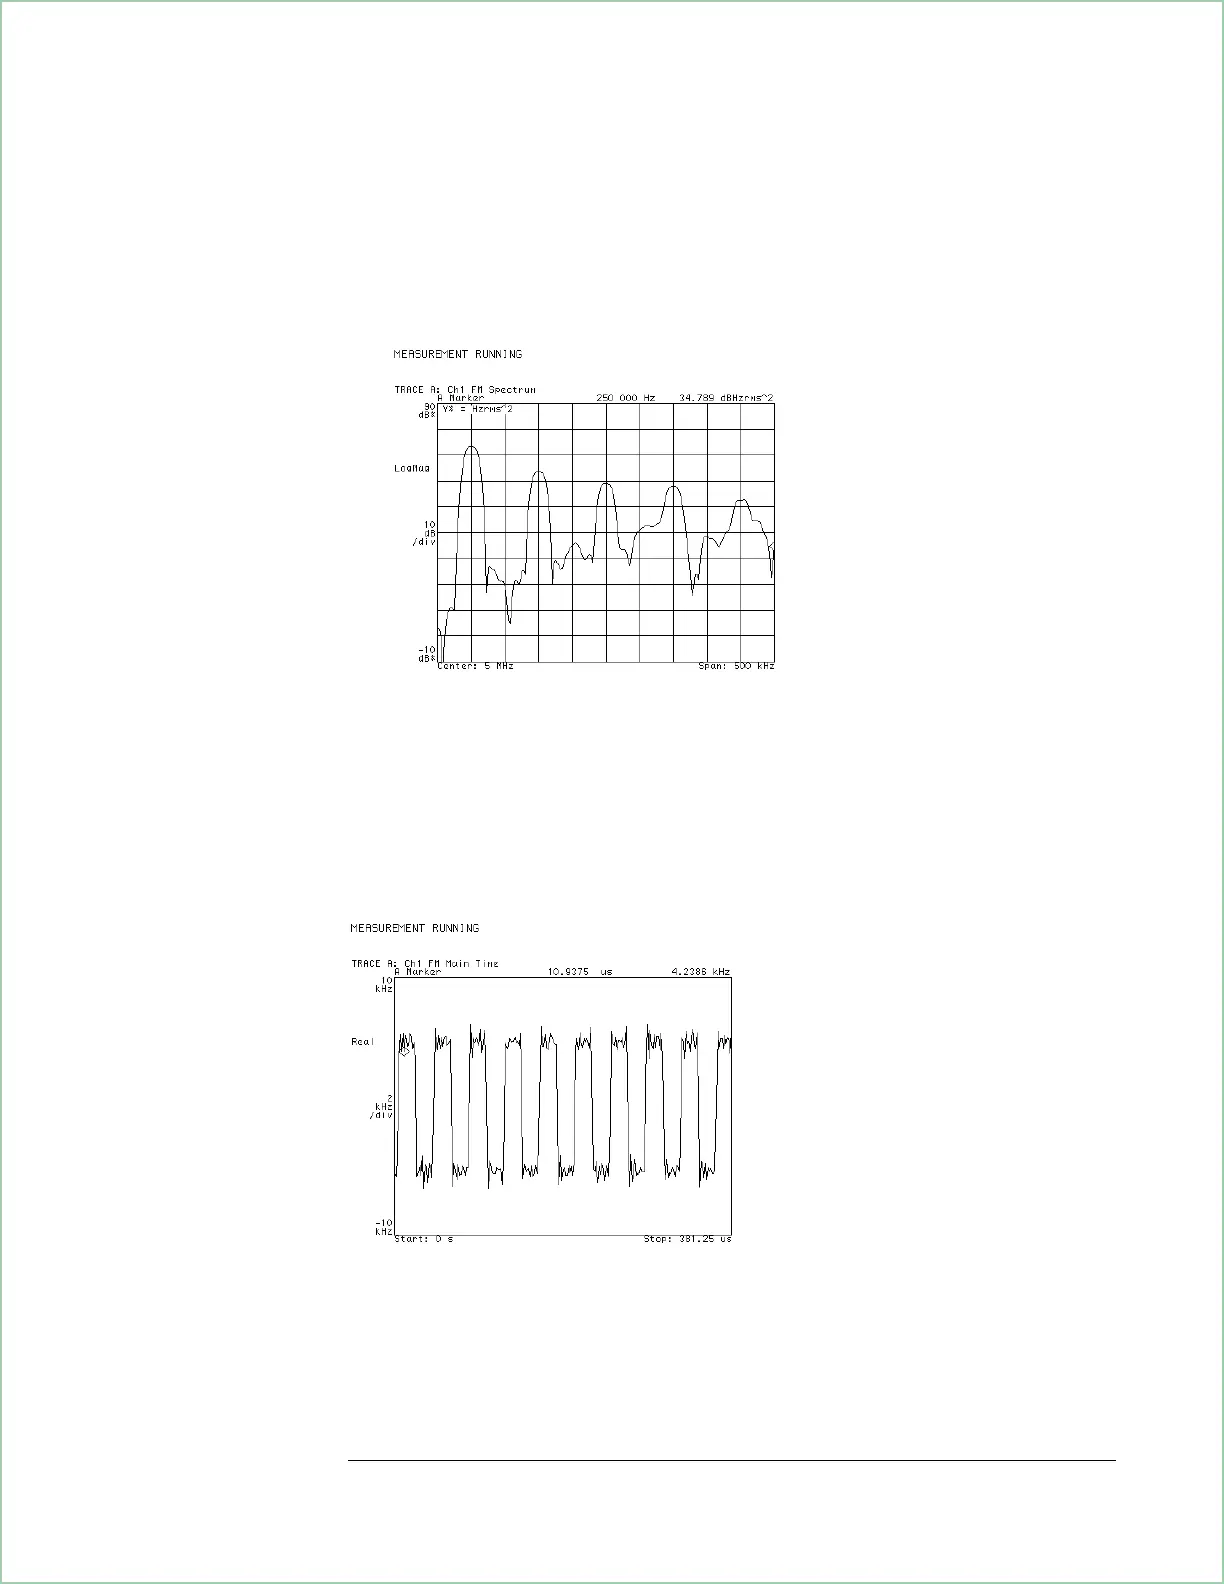
The display should now appear as shown below.
The FM demodulated spectrum.
8. Examine the recovered signal:
Press [
Measurement Data
], [
main time
]([
main time ch1
] in a 2-channel analyzer)
to display the time data.
Press [
Trigger
], [
trigger type
], [
internal source
] to stabilize the display.
Press [
Auto Scale
] to scale the display information.
Press [
Display
], [
more display setup
], [
grids off
].
The display should now appear as shown below.
The recovered signal is in Hz as a function of time.
The recovered time data is displayed as a square wave because the relation
between phase modulation and frequency modulation is a derivative and
the derivative of a triangle wave is a square wave. Compare this recovered
FM signal with the recovered PM signal in the previous task.
Demodulating an Analog Signal
1-7