4. Turn on a second trace and configure it to display stable time data:
Press [
Display
], [
2 grids
].
Press [
Trigger
], [
trigger type
], [
internal source
].
Press [
B
].
Press [
Measurement Data
], [
main time
]
([
main time ch1
] for a 2-channel analyzer).
Press [
Auto Scale
].
5. Set up a gate to encompass the first burst:
Press [
Time
], [
gate on
], [
ch1 gate dly
].
Pre ss [
Marker|Entry
] to turn on the Entry LED.
Rotate the knob to align the left gate marker with the beginning of the
first burst.
Press [
gate length
]
Rotate the knob to align the right gate marker with the end of the first
burst.
6. Turn off the grids to highlight the gate markers:
Press [
Display
], [
more display setup
], [
grids off]
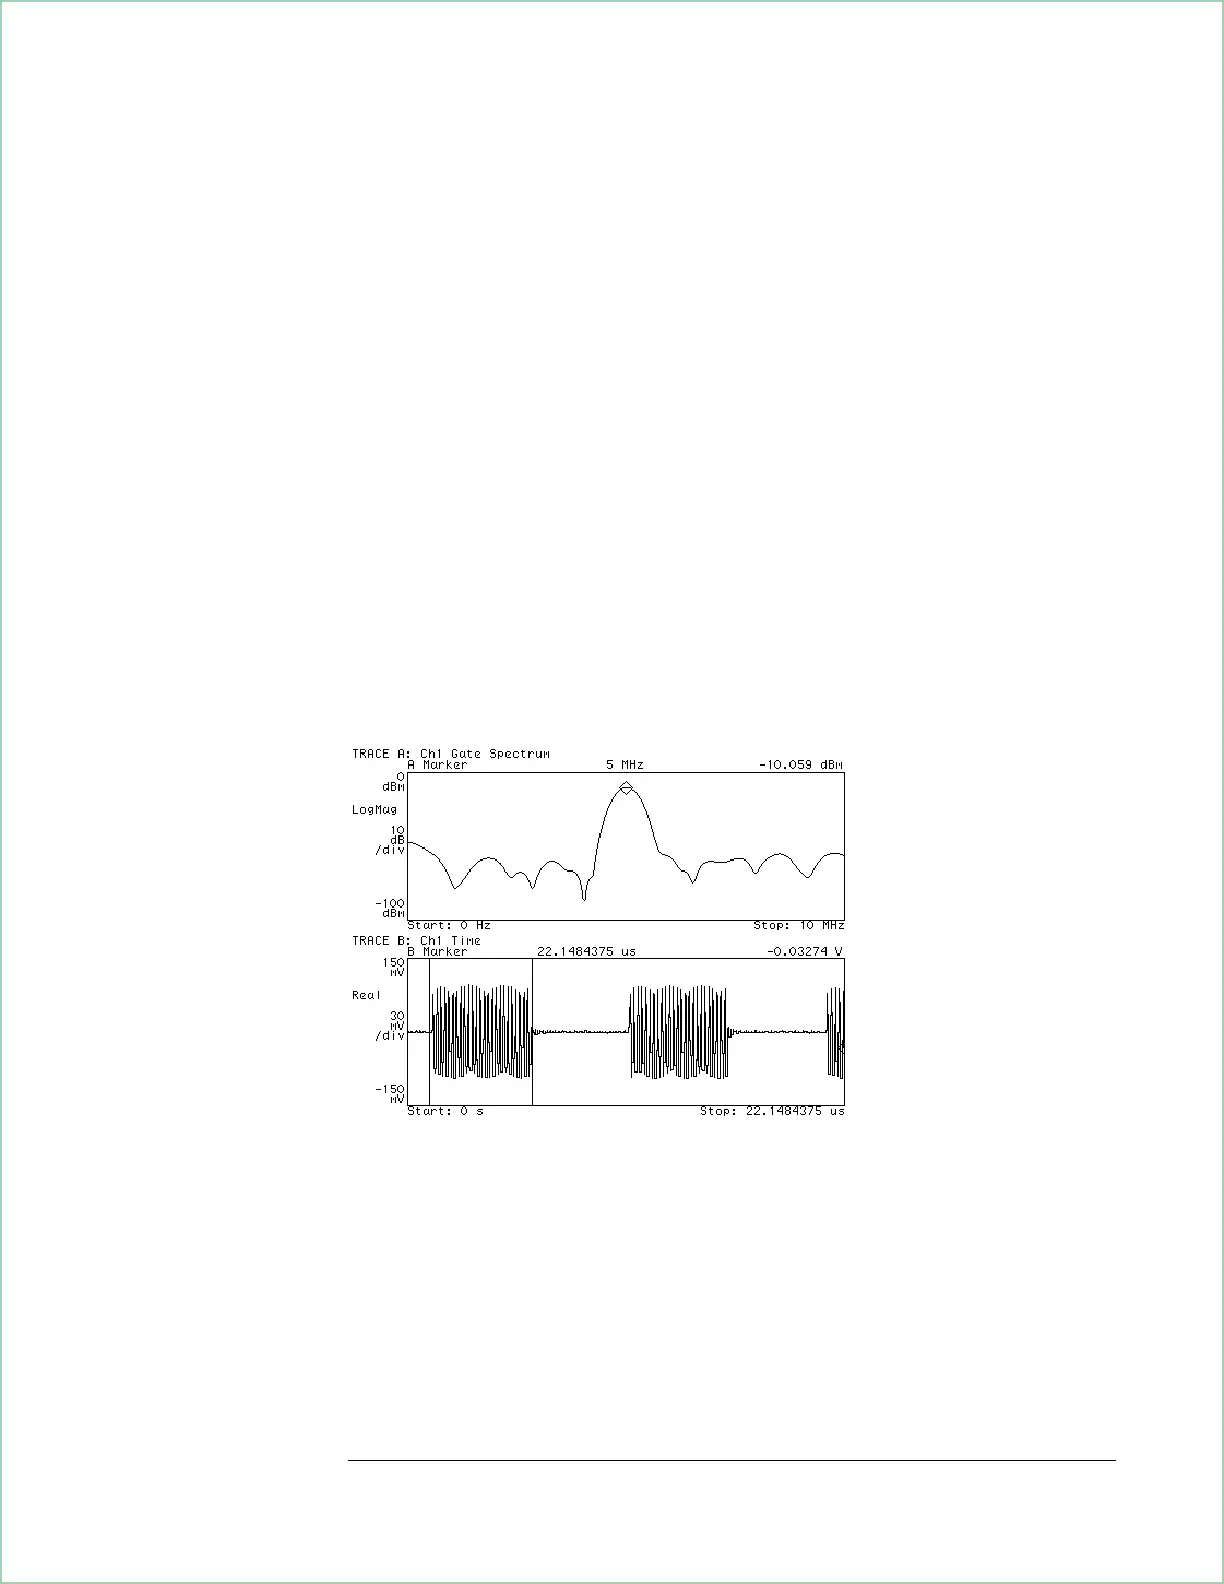
The display should now appear as below.
The lower trace displays the time domain signal with a gate
encompassing the first burst. The upper trace displays the
frequency spectrum of the gated burst.
Making On/Off Ratio Measurements
4 - 3