6. Move the marker to the next trace in the waterfall display.
Press [Marker Function] followed by the up-arrow key.
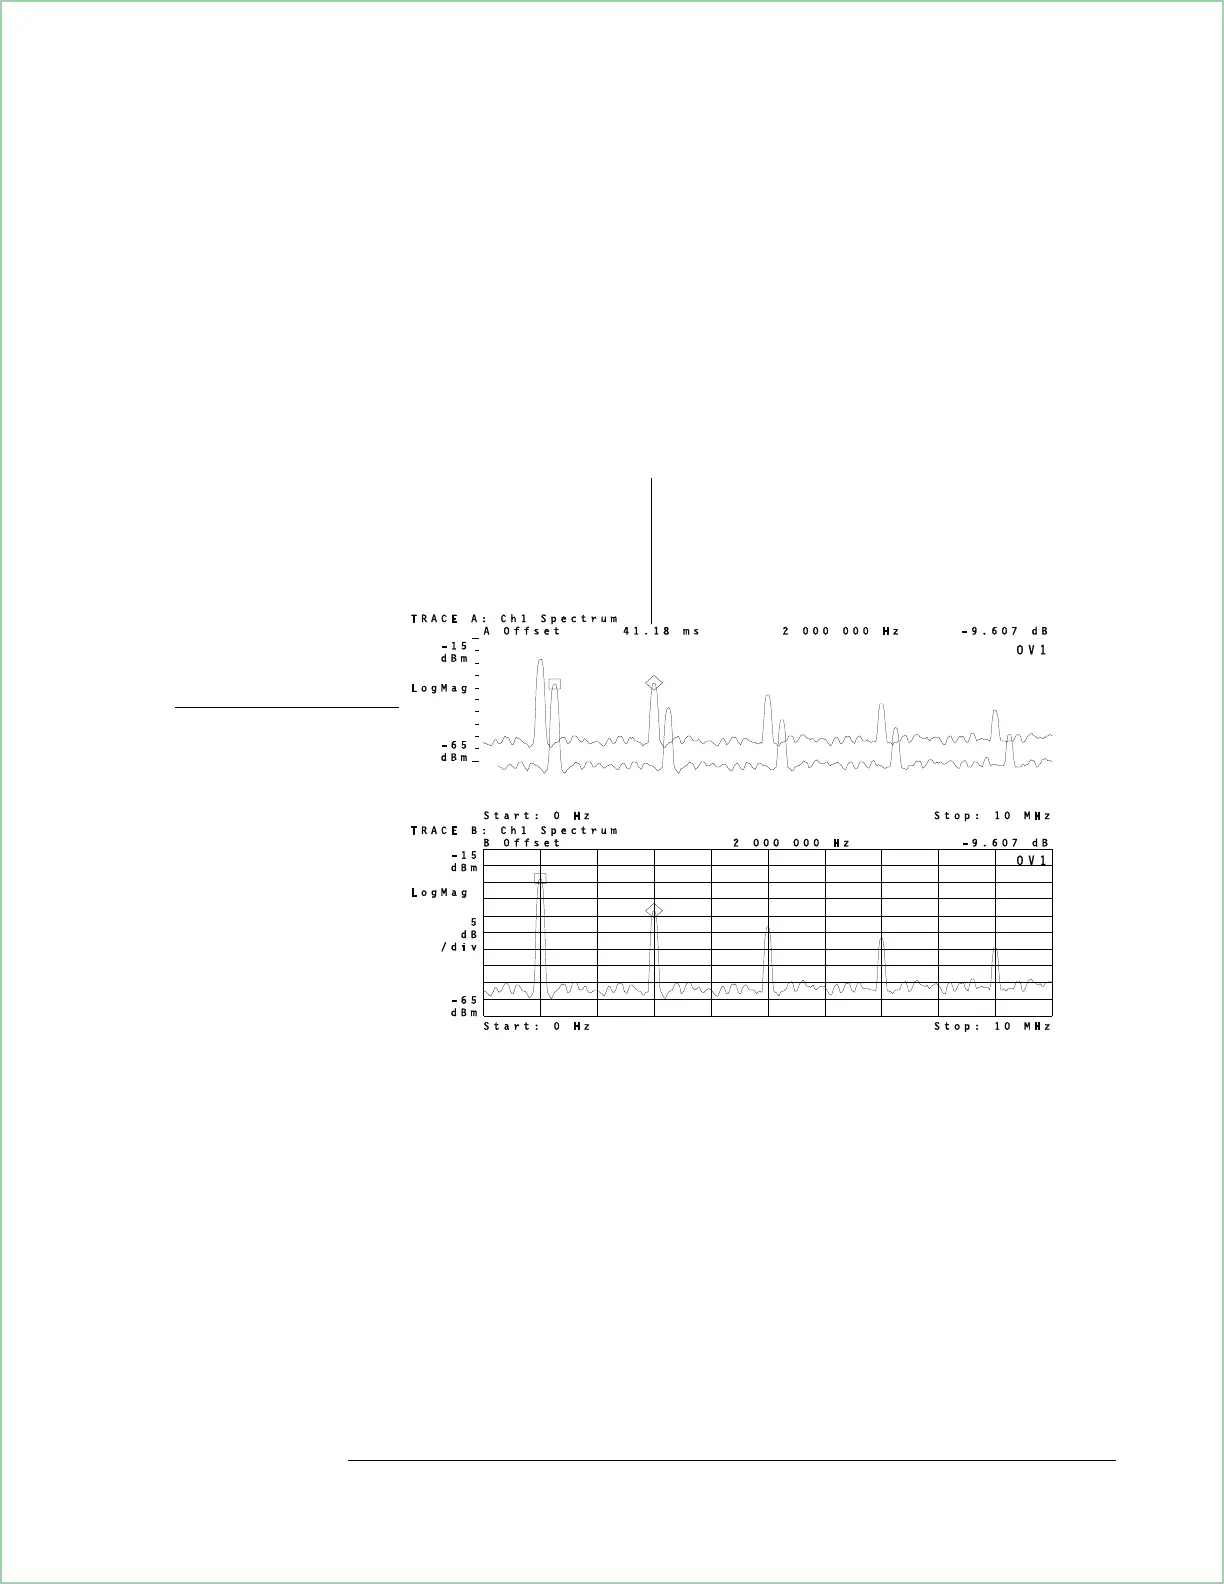
In this example, notice that the z-axis marker value is approximately 41.2
ms, which is the elapsed time between the two traces. In other words,
41.2 ms elapsed from when the analyzer acquired trace 2 to when it
acquired trace 1. The amount of time needed to acquire each trace is
dependent on several factors and may be different than that shown in this
example.
Using Markers with a Waterfall Display
A diamond shows the
location of the marker.
A square shows the
location of the offset
marker.
When the offset marker is on, marker
values are relative to the offset
marker. In this example, the selected
trace was acquired approximately
41.2 ms after the previous trace.
Using Waterfall and Spectrogram Displays (Opt. AYB)
7 - 9