DISPLAYING DATA
iKon-L SECTION 6
Page 101
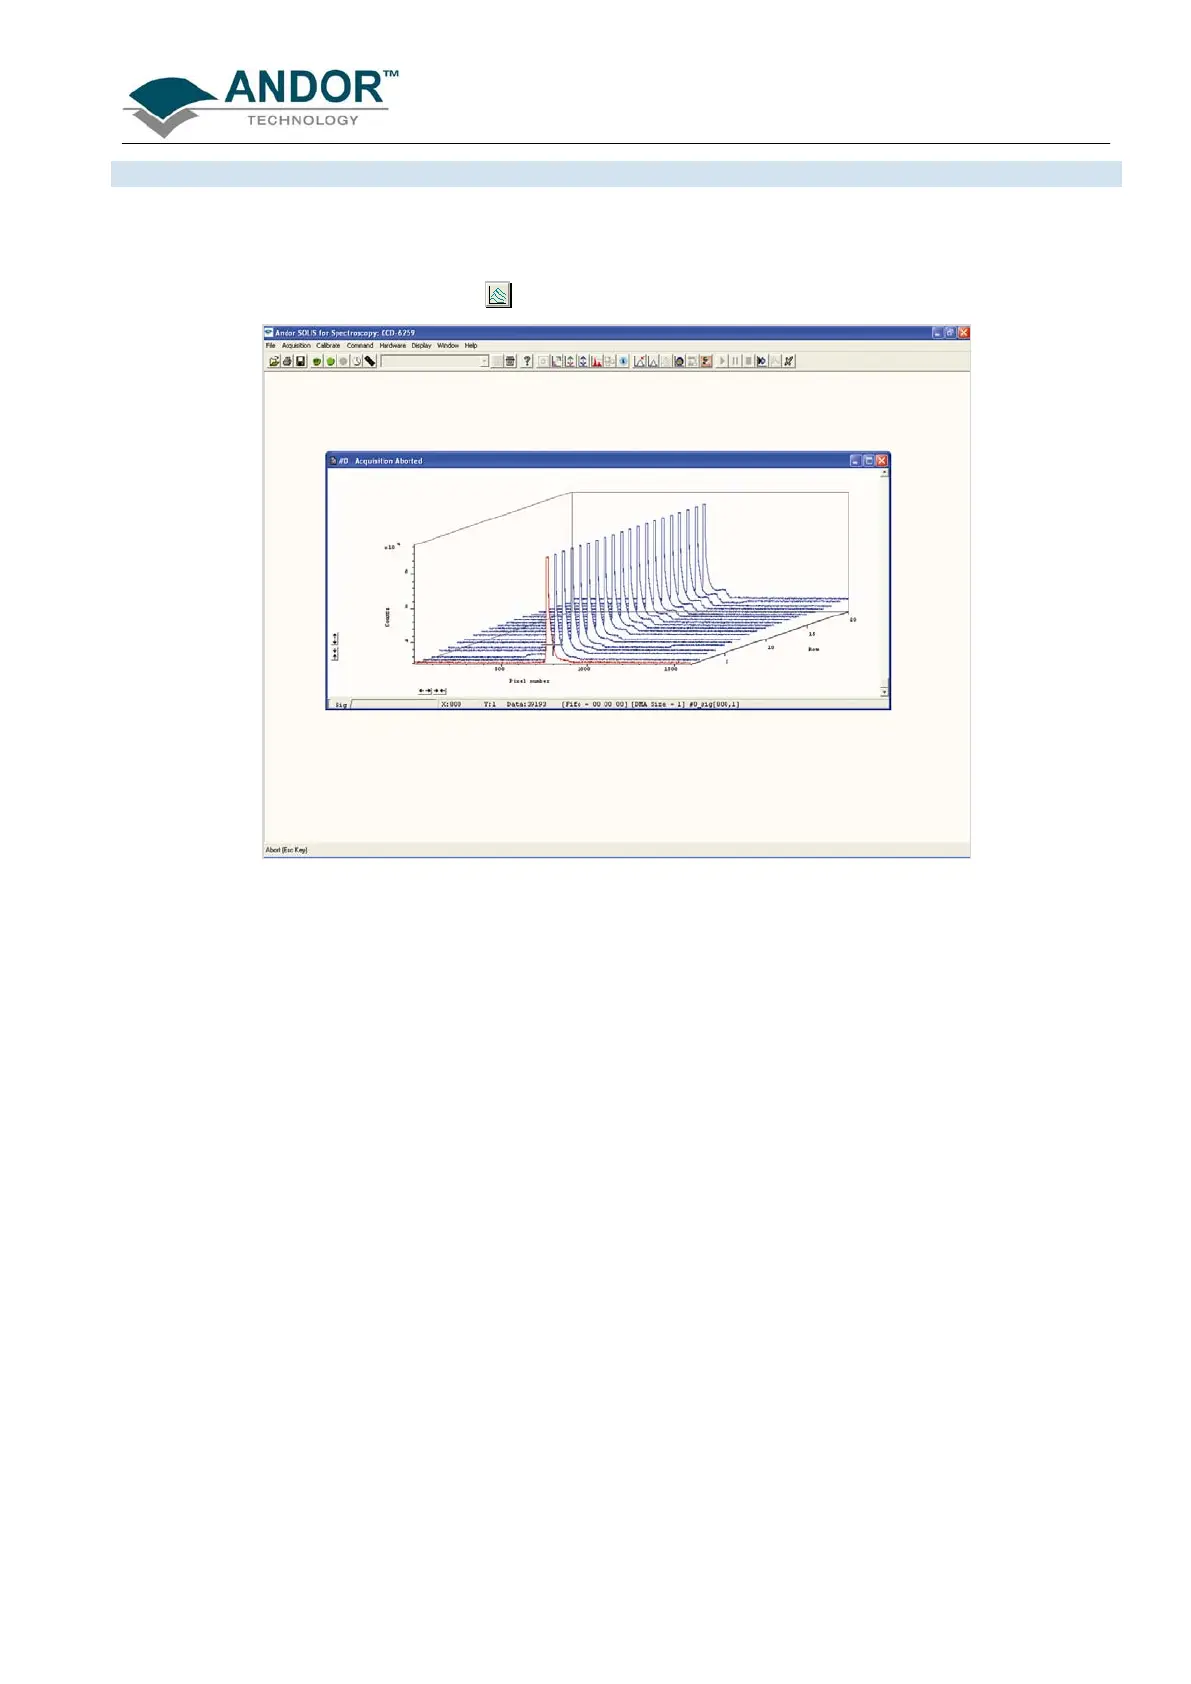
If you have acquired data in Imaging mode or as a Kinetic series you can view the traces taken from all the
rows or tracks on one set of axes in a data window. Select the 3D option from the Change Display Mode
option on the Display menu or click the
button and a data window will appear e.g.:
Along with the x-axis (calibrated by default to represent pixels across the CCD-chip) and the data-axis
(calibrated by default in counts), you now see a 3
rd
(or y-axis) calibrated in rows or tracks, depending on the
acquisition mode you have selected.
To read off a data value on a particular trace, use the scroll bar on the data window to move the trace into the
plane delineated by the x- and data-axes, and click on the trace to position the cursor on the point of interest
(you may need to use the left and right arrow keys on your keyboard to position the cursor precisely).
The numeric display on the status bar along the bottom edge of the data window will indicate the series
member on which the cursor is positioned (‘Kinetics’), along with the corresponding x- and data-values.
If your data set contains a series of images (each of which may represent data acquired in Kinetics Mode) you
will notice that the data window has two scroll bars, placed end to end. The upper scroll bar allows you to move
between the members of the series, while the lower scroll bar allows you to view the traces that make up the
particular member of the series.
NOTE: The Zooming, Scrolling and Reset functions are the same as 2D mode.
 Loading...