DISPLAYING DATA
iKon-L SECTION 6
Page 119
The ROI Counter identifies the current active ROI. It can also be used to select and isolate a particular ROI,
which can be a useful tool, e.g. if two ROIs are overlapping or are layered on top of each other. By clicking the
down arrow, you can also see how many ROIs are currently defined.
6.11.2 - Hot Spot Approximation
Hot Spot Approximation can be used to take a selected percentage of the highest data values within a given
ROI.
To select, click on the
button, then select the % required from the drop-down menu. For example selecting
50% will give you the mean value for the top 50% of pixel values within the ROI.
To recalculate the values in the ROI window, click on the button.
You can receive and calculate ROI data, while the system is acquiring a Kinetic Series or running in Real Time
Mode.
To select, click on the
button. The software is then able to acquire data and at the same time calculate and
tabulate ROI data.
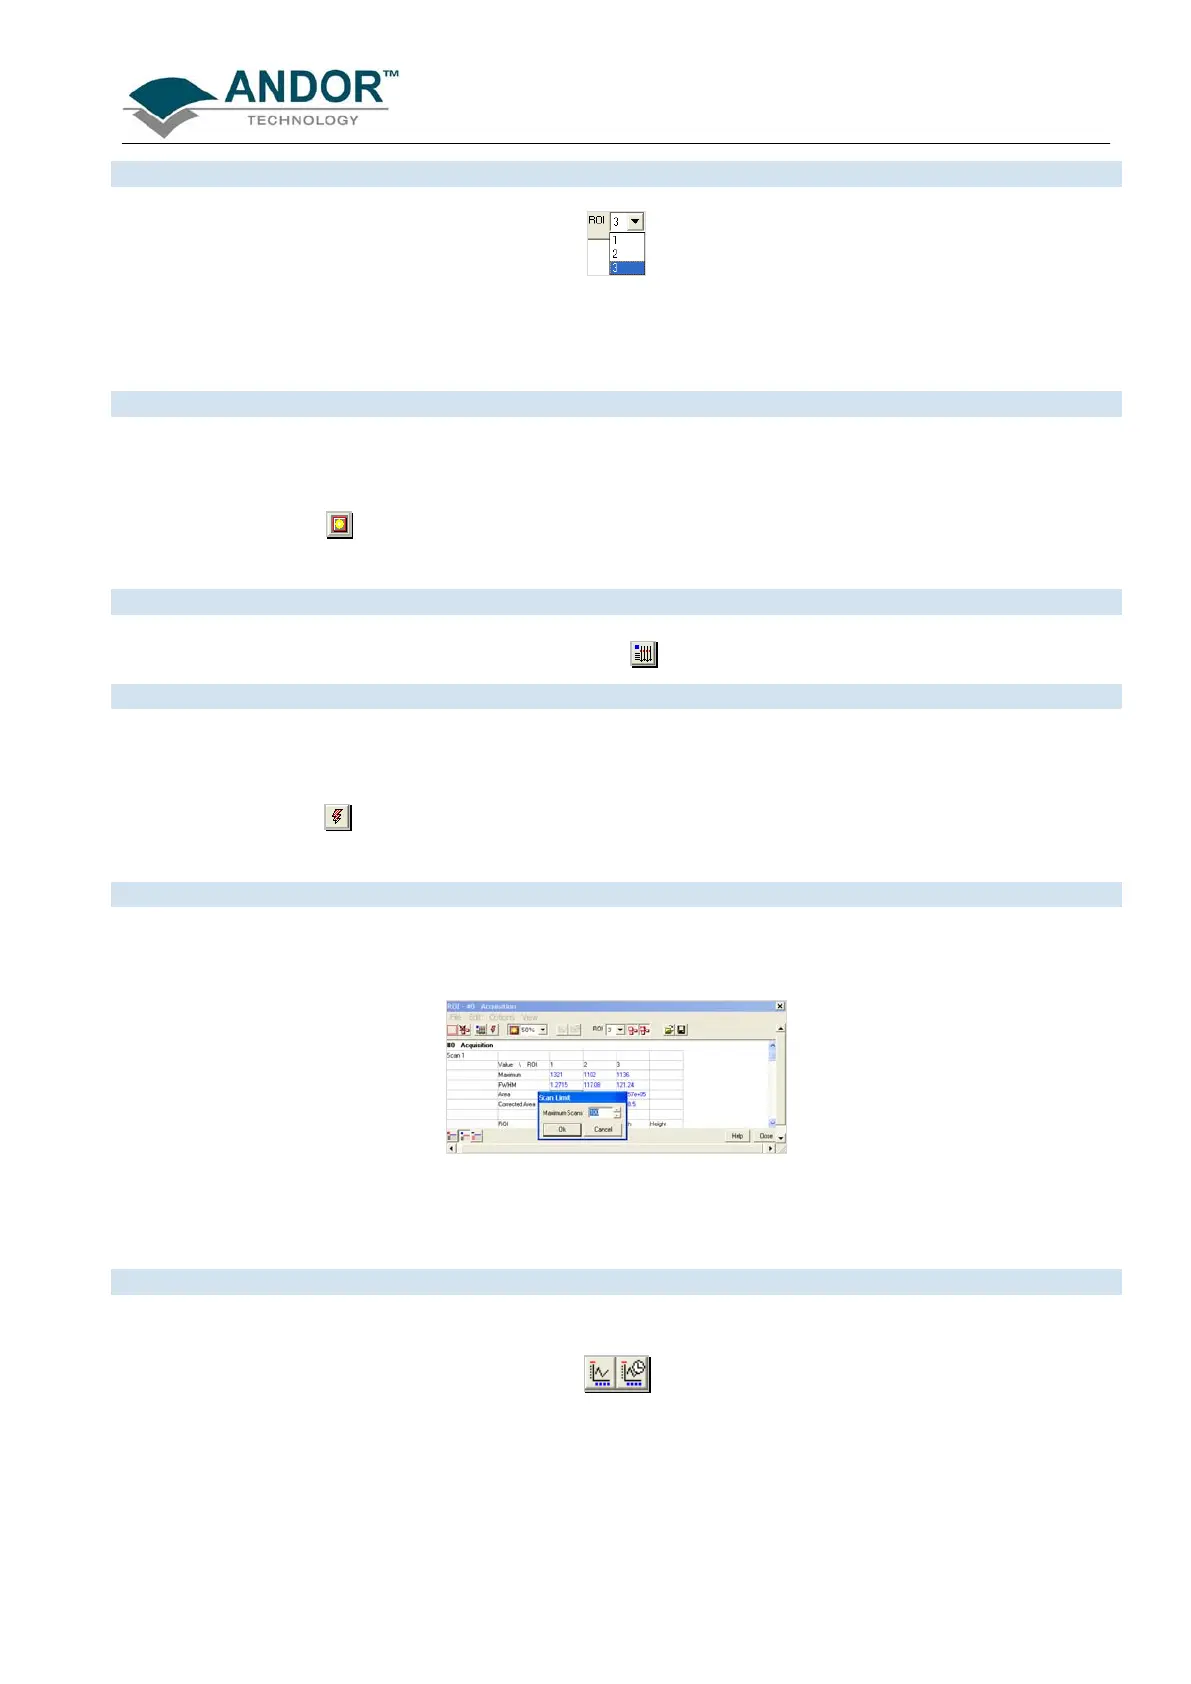
When the Maximum Scans is selected from Options drop-down menu of the ROI dialog box, the Maximum
Scans dialog appears, e.g.:
You can then enter the length of the history buffer you require (i.e. the number of previous values stored when
acquiring in Real Time Mode with the Live Update feature enabled). NOTE: This defaults to 100 and can be
modified for longer series.
Select any data value for a particular ROI and series position and the following buttons become available:
Clicking on these buttons will create a new dataset window displaying the currently selected property values
plotted against series position or time.
 Loading...