DISPLAYING DATA
iKon-L SECTION 6
Page 114
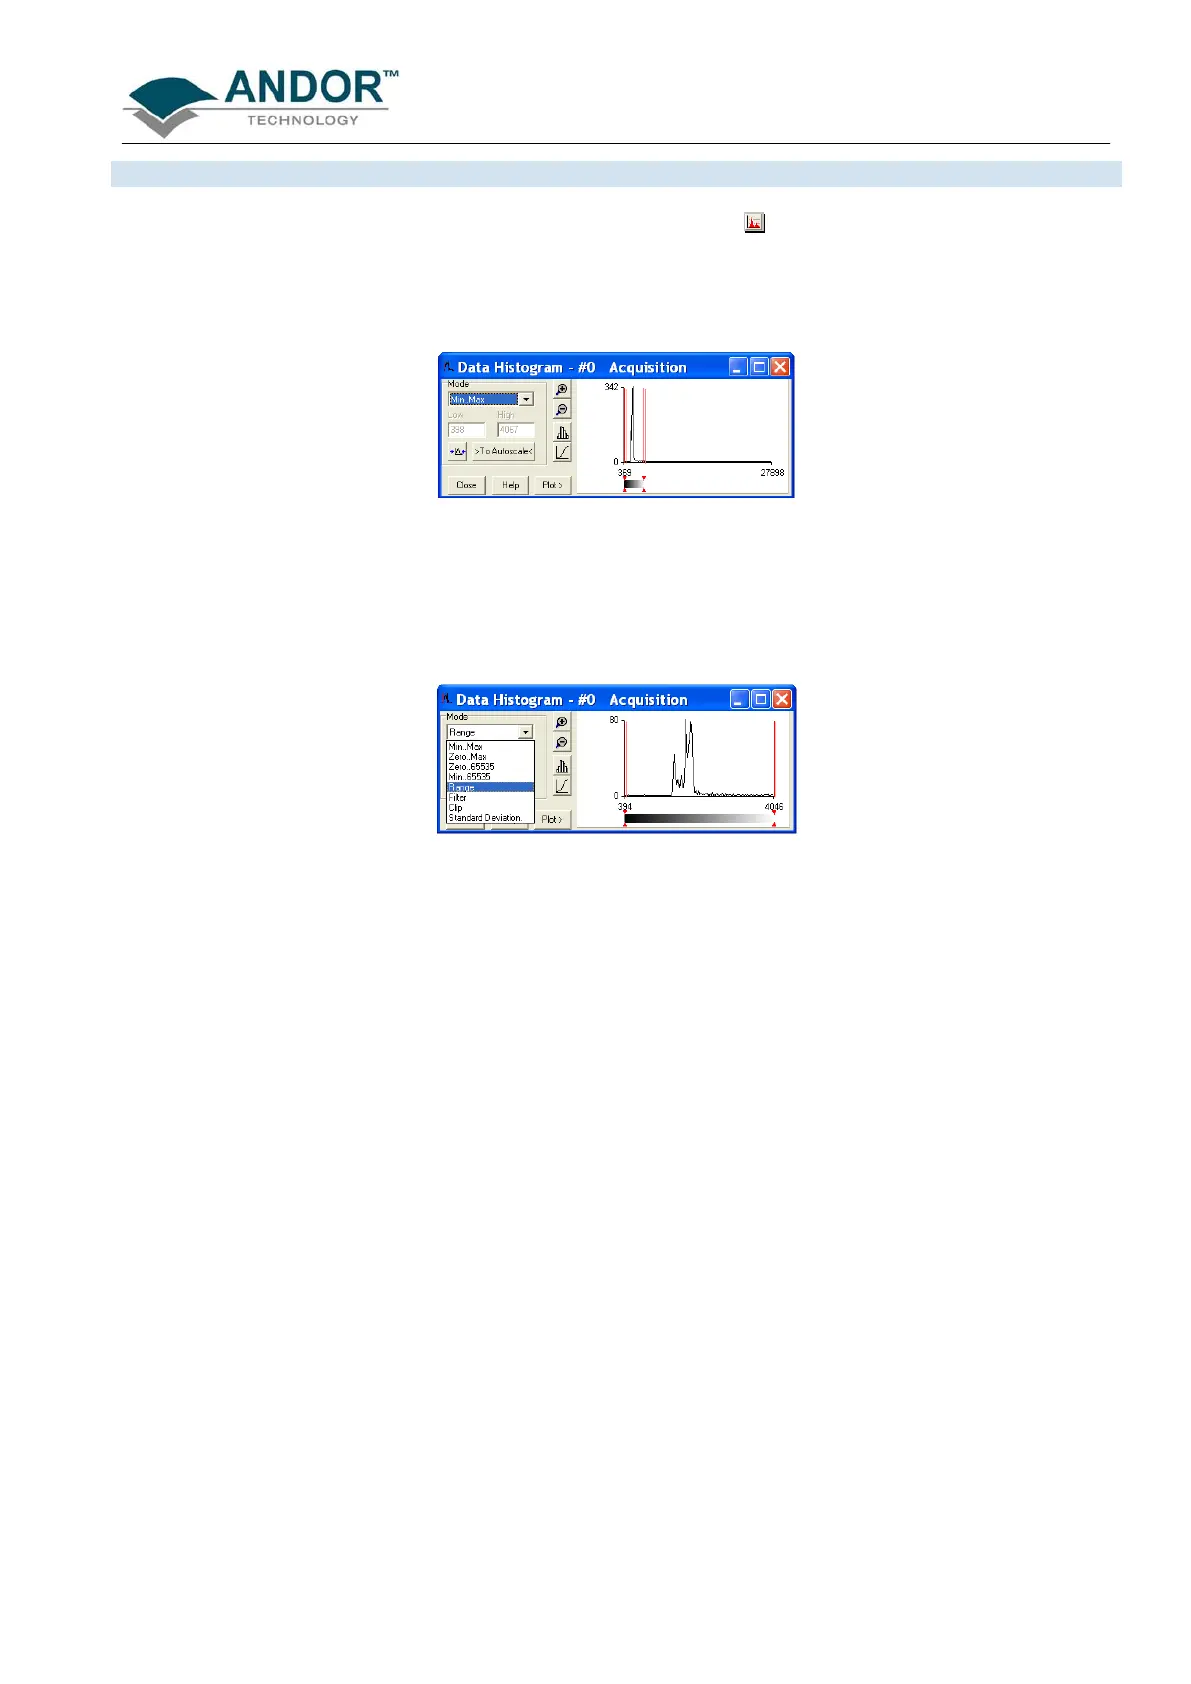
The Data Histogram dialog Box is launched either by clicking on the icon on the Main Window, or selecting
Data Histogram from the Display drop-down menu. This tool allows you to plot a histogram, or graph, between
the maximum and minimum data points in the displayed range. It also contains a filter drop down menu, which
allows for more accurate analysis and presentation of data values, e.g.:
By clicking on an open data window, its histogram will be displayed on the Data Histogram dialog. When
plotting the histogram, the focus is transferred to the new data window and the displayed histogram is that of
the plotted histogram. The data from which the histogram is displayed is indicated on the title bar of the Data
Histogram dialog. To return the focus on the original data, click on the original data window.
Modes to view specific areas of spectra can also be selected through the drop-down menu, e.g.:
 Loading...