DISPLAYING DATA
iKon-L SECTION 6
Page 115
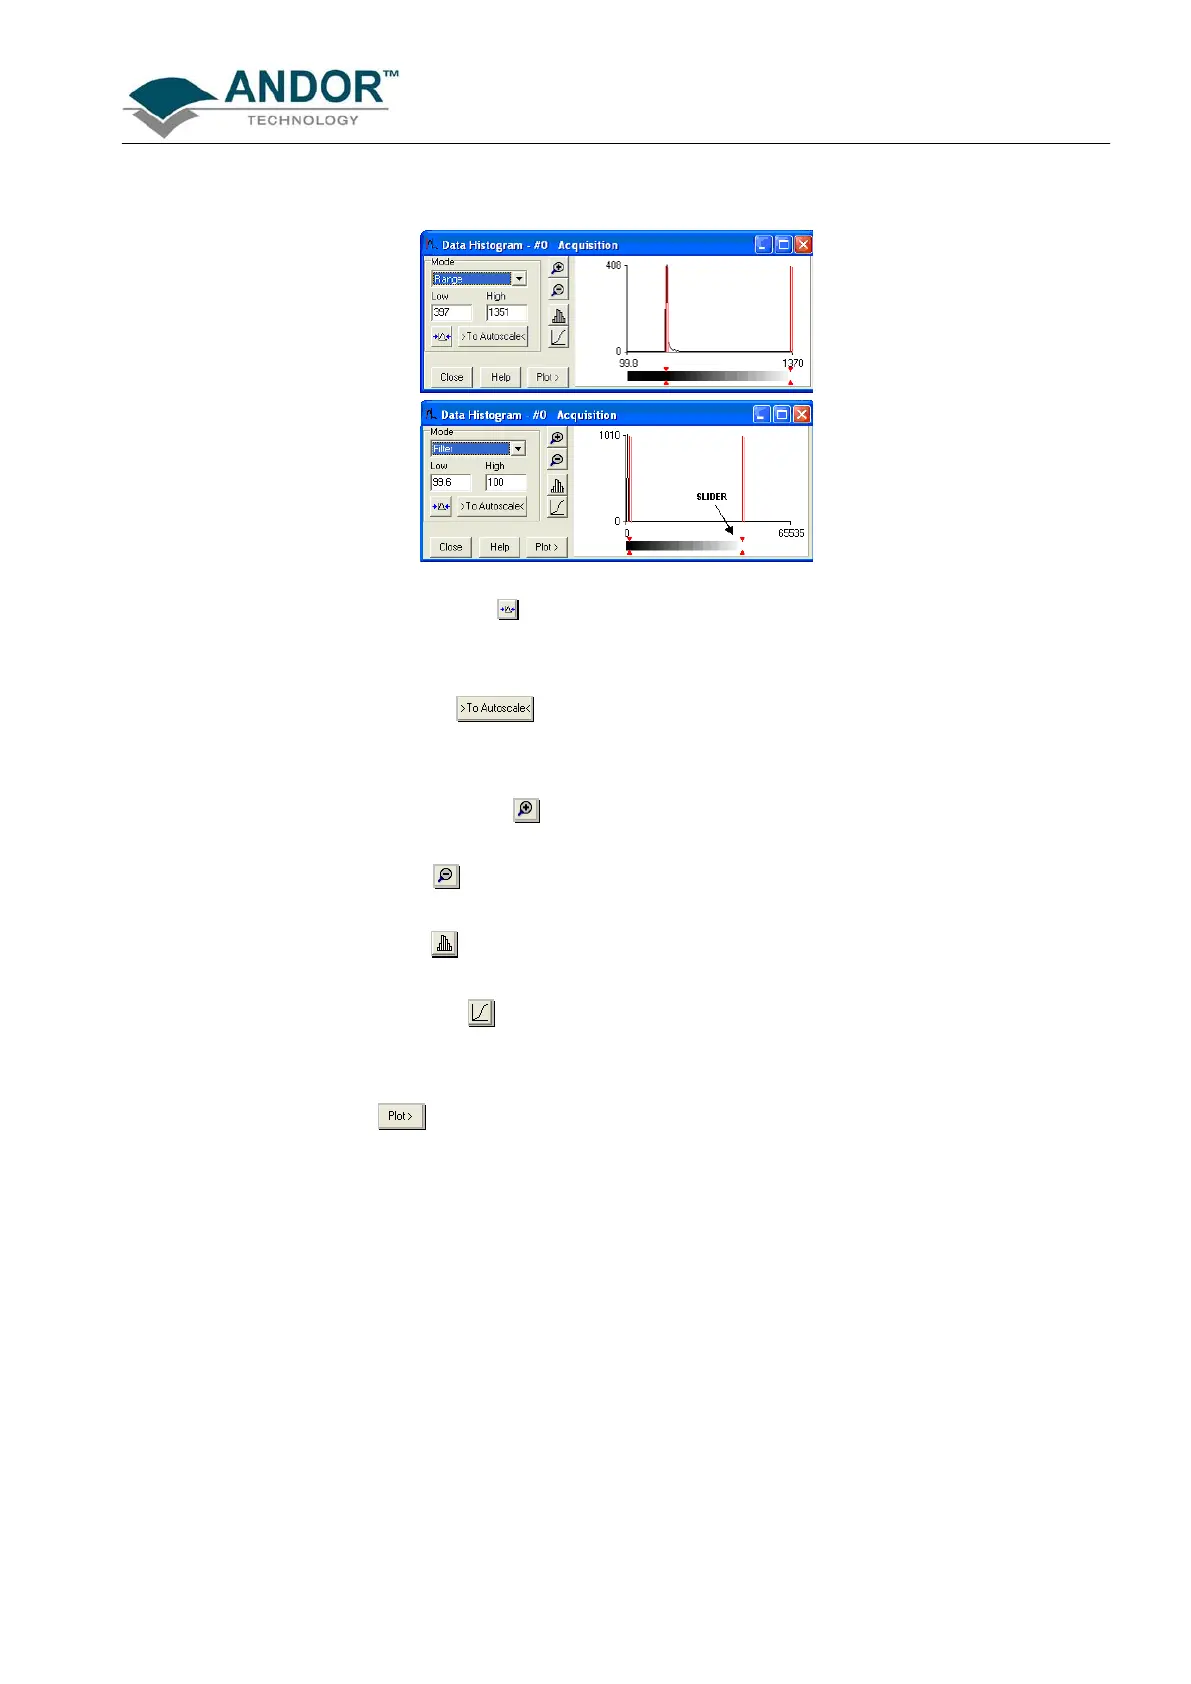
Values can be modified either by typing in the new values in the Low and High text boxes or by dragging the
red arrows and bars below the histogram, e.g.:
• Update: when the Update button
is clicked any change on the mode and/or the Low/High values is
updated
• Autoscale: after clicking the button, acquisitions that follow will use these scaling settings as
default
• Expand to bounds: clicking on the button zooms in on the histogram
• Zoom Out: clicking on the button zooms out of the histogram
• Bar Chart: clicking on the button toggles between x-y and bar chart histogram display
• Cumulative: clicking on the button toggles between cumulative (integral) and non-cumulative
histogram display
• Plot: clicking on the button plots the histogram into a data window
 Loading...