DISPLAYING DATA
iKon-L SECTION 6
Page 106
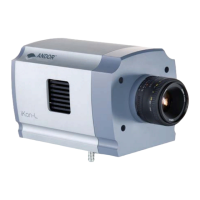
The Palette bar: runs across the top of the data window. This
shows the full palette of grays or colors available in each color mode. The palette is graded so that lower data
values correspond to the darker tones to the left of the palette, and higher data values correspond to the
brighter tones to the right of the palette.
• The arrows to the left of the Palette bar on the data window allow you to adjust the minimum
distinguishable data value (i.e. min, the value at which the Palette bar becomes black), e.g.:
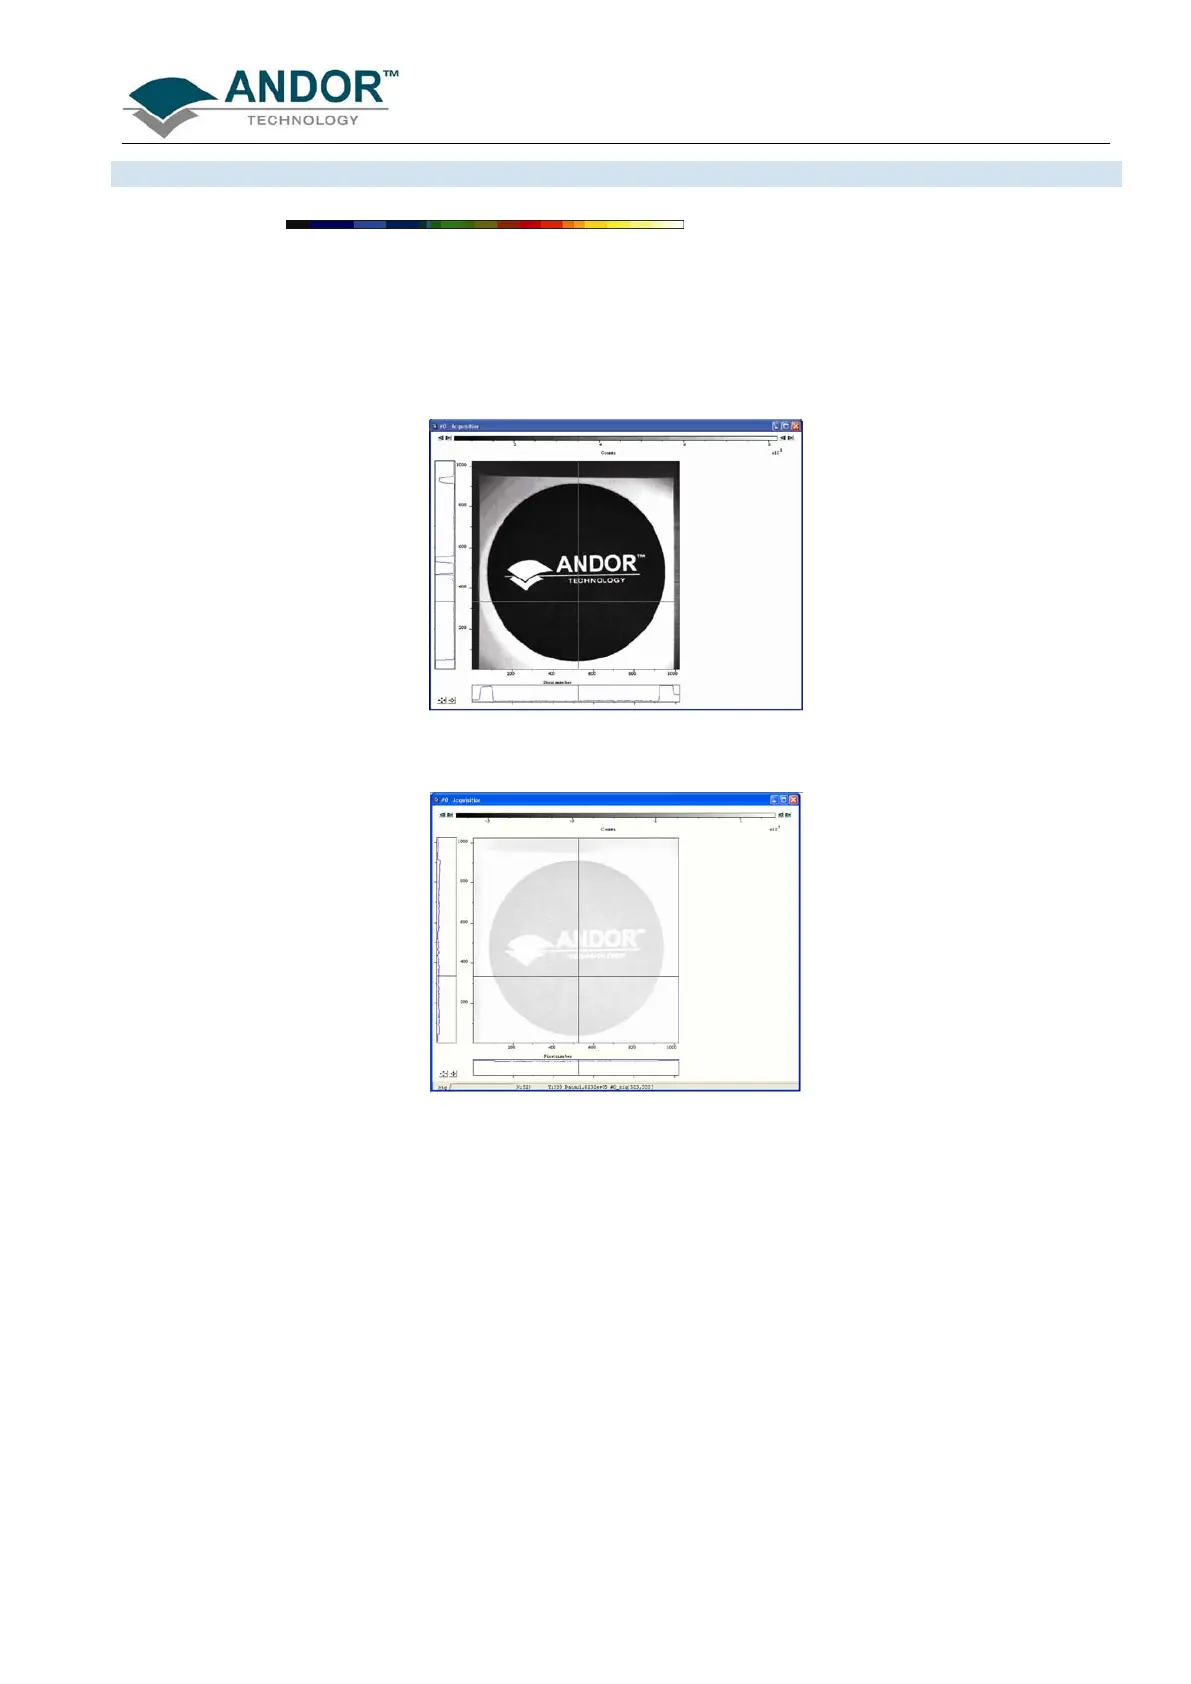
• The arrows to the right of the Palette bar on the Data Window allow you to adjust the maximum
distinguishable data value (i.e. max, the value at which the Palette Bar becomes white), e.g.:
The scale on the Palette bar is calibrated in your chosen data units. By default, the full range of colors/grays is
correlated with the full range of data in your data set. This is known as ‘Rescaling’ (see Rescale on page
108).
Adjusting the Brightness & Increasing and Decreasing Contrast later in this section explain how you can
use these controls to change the brightness and contrast of the display.
 Loading...