DISPLAYING DATA
iKon-L SECTION 6
Page 96
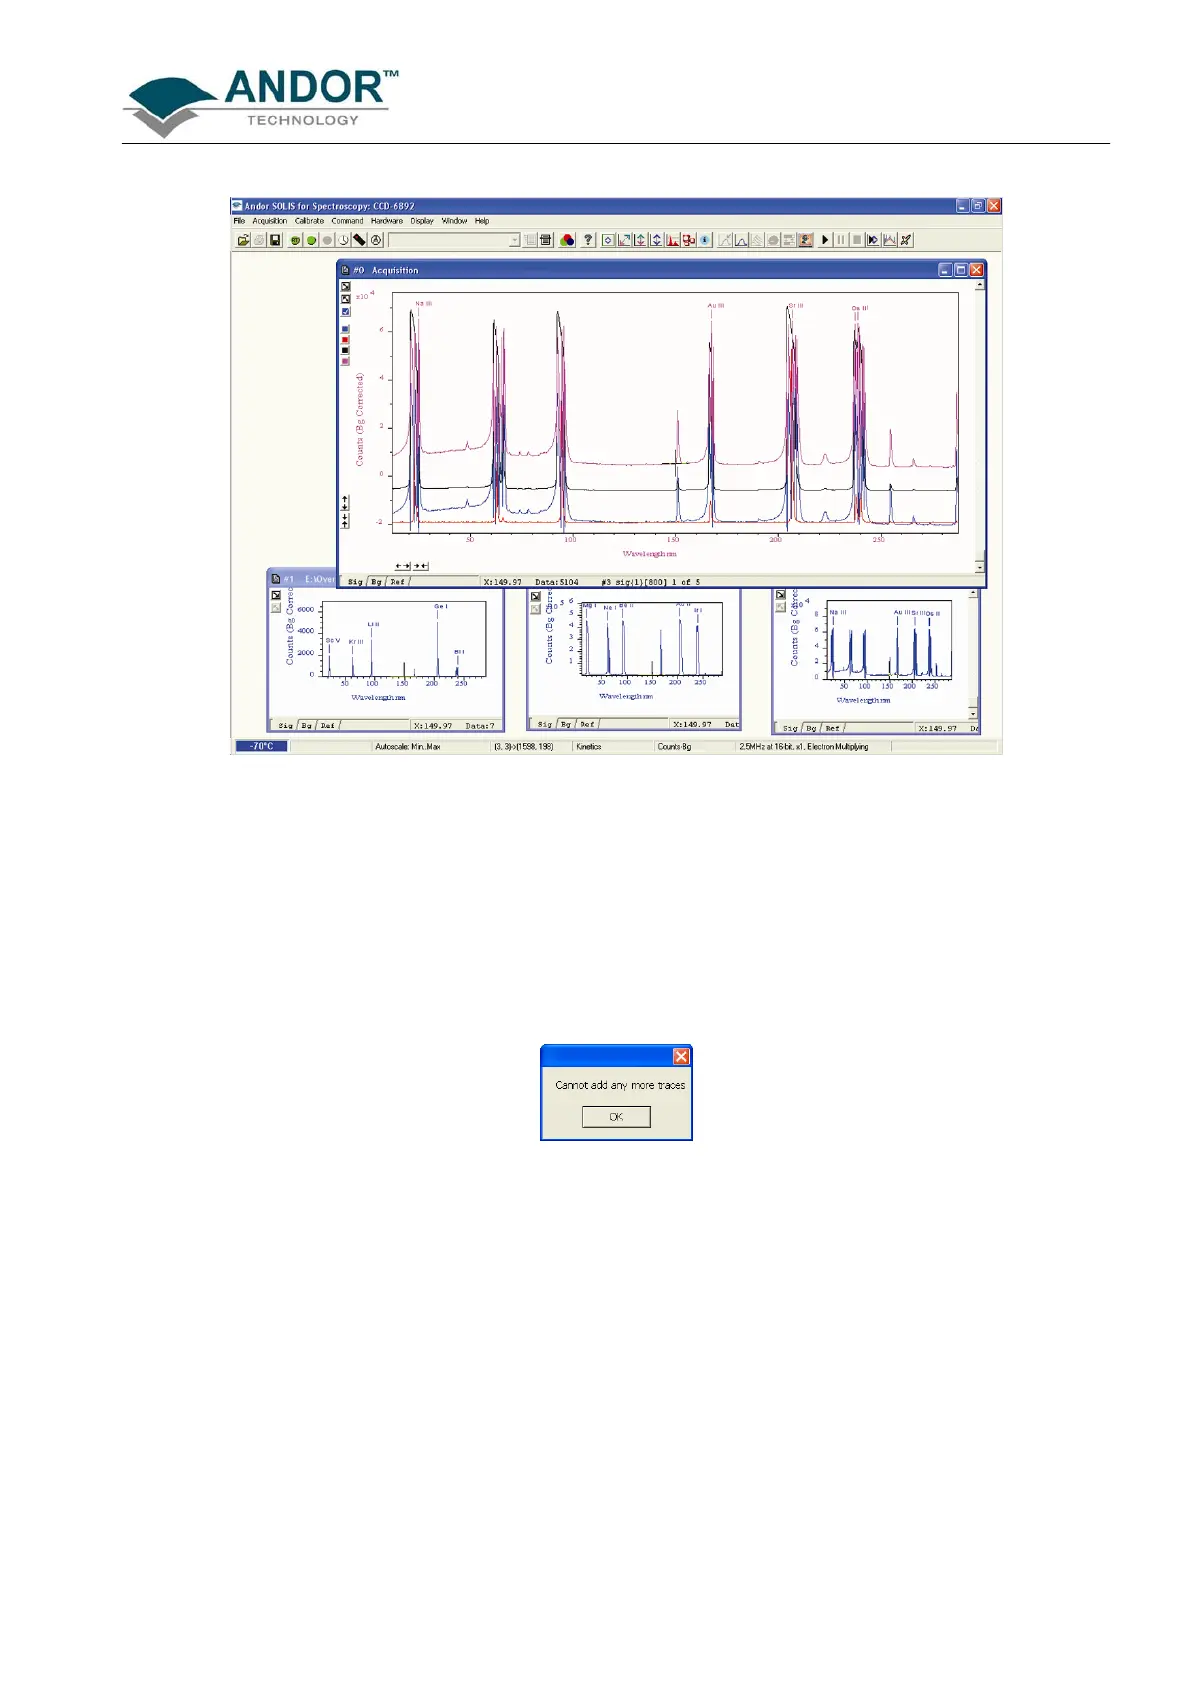
• Once you have selected the required file(s) and clicked OK, the display will change, e.g.:
NOTE: You can add up to a maximum of 8 overlays to your original data trace.
The original data trace is always displayed in blue. Each new overlay appears in a unique identifying color and
the Active Trace button is displayed on the left in the same color.
• To manipulate the trace you want, click on the Active Trace button corresponding to the color of the
trace you wish to work with. The values on the horizontal and vertical axes will change to correspond to
the Active Trace and will be presented in the same color as the trace itself.
• Once active, a trace can be manipulated the same manner as any 2D Display. If you try to add too
many traces, you will be prompted with the following message:
 Loading...