5.1.1.1.3.- Demand parameters.
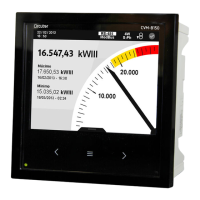
On this screen, Figure 39, you can view all the maximum demand parameters indicated in
Tabla 10.
For each of the demand parameters you can view:
Graphical representation of the parameter.
The analogue representation of the parameter.
The value for each tariff, T1, T2 and T3.
A bar chart with the indications of the instantaneous value, maximum and minimum
values and alarms, see “4.4.3. CENTRAL AREA”.
Figure 39: Demand parameters (display 1 parameter).
Table 10:Demand parameters (displays 1 parameter).
Icon
Display 1 parameter
Demand parameters.
Current
Active power
Apparent power
The following icons appear for all these parameters on the screen:
Indicating that the parameter refers to consumed or generated energy.
If the 2 icons light up at the same time, it means the installation is not properly connect-
ed.
Use the keys
and to browse the various parameters.
If there is an alarm associated with the variable being displayed, the following will be shown:
The module with which the alarm is associated.
50
CVM-B100 - CVM-B150
Instruction Manual