Monitoring
90 Instructions for use Oxylog 3000 plus SW 1.n
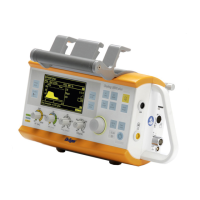
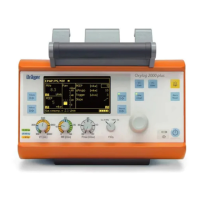
Displaying curves
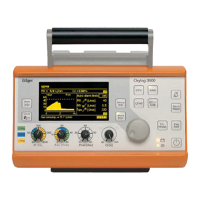
The curve window can display the airway pressure
curve Paw, the flow curve or the CO
2 curve
(optional). Refer to "Screen structure" on page 32.
To display a different curve:
Press the Curves key.
Displaying measured values
Measured values are displayed in the measured
values window.
To switch between the values:
Press the Values key: the next value pair
is displayed on the screen.
The following values can be displayed:
–MVe
–FiO2
–f
–VTe
– PEEP
– Pmean
–PIP
–Pplat
– MVespon
– RRspon
–etCO
2
When the CO2 sensor is connected to the
ventilator, the etCO
2 value will be shown
automatically in the measured values window.
The values are shown in pairs; the pairs of values
can be configured as required. Refer to "Customer
Service Mode" on page 97.
Curves
 Loading...
