VIsualEyes 515/525 - Additional Information Page 110
9.4 Optokinetic tests
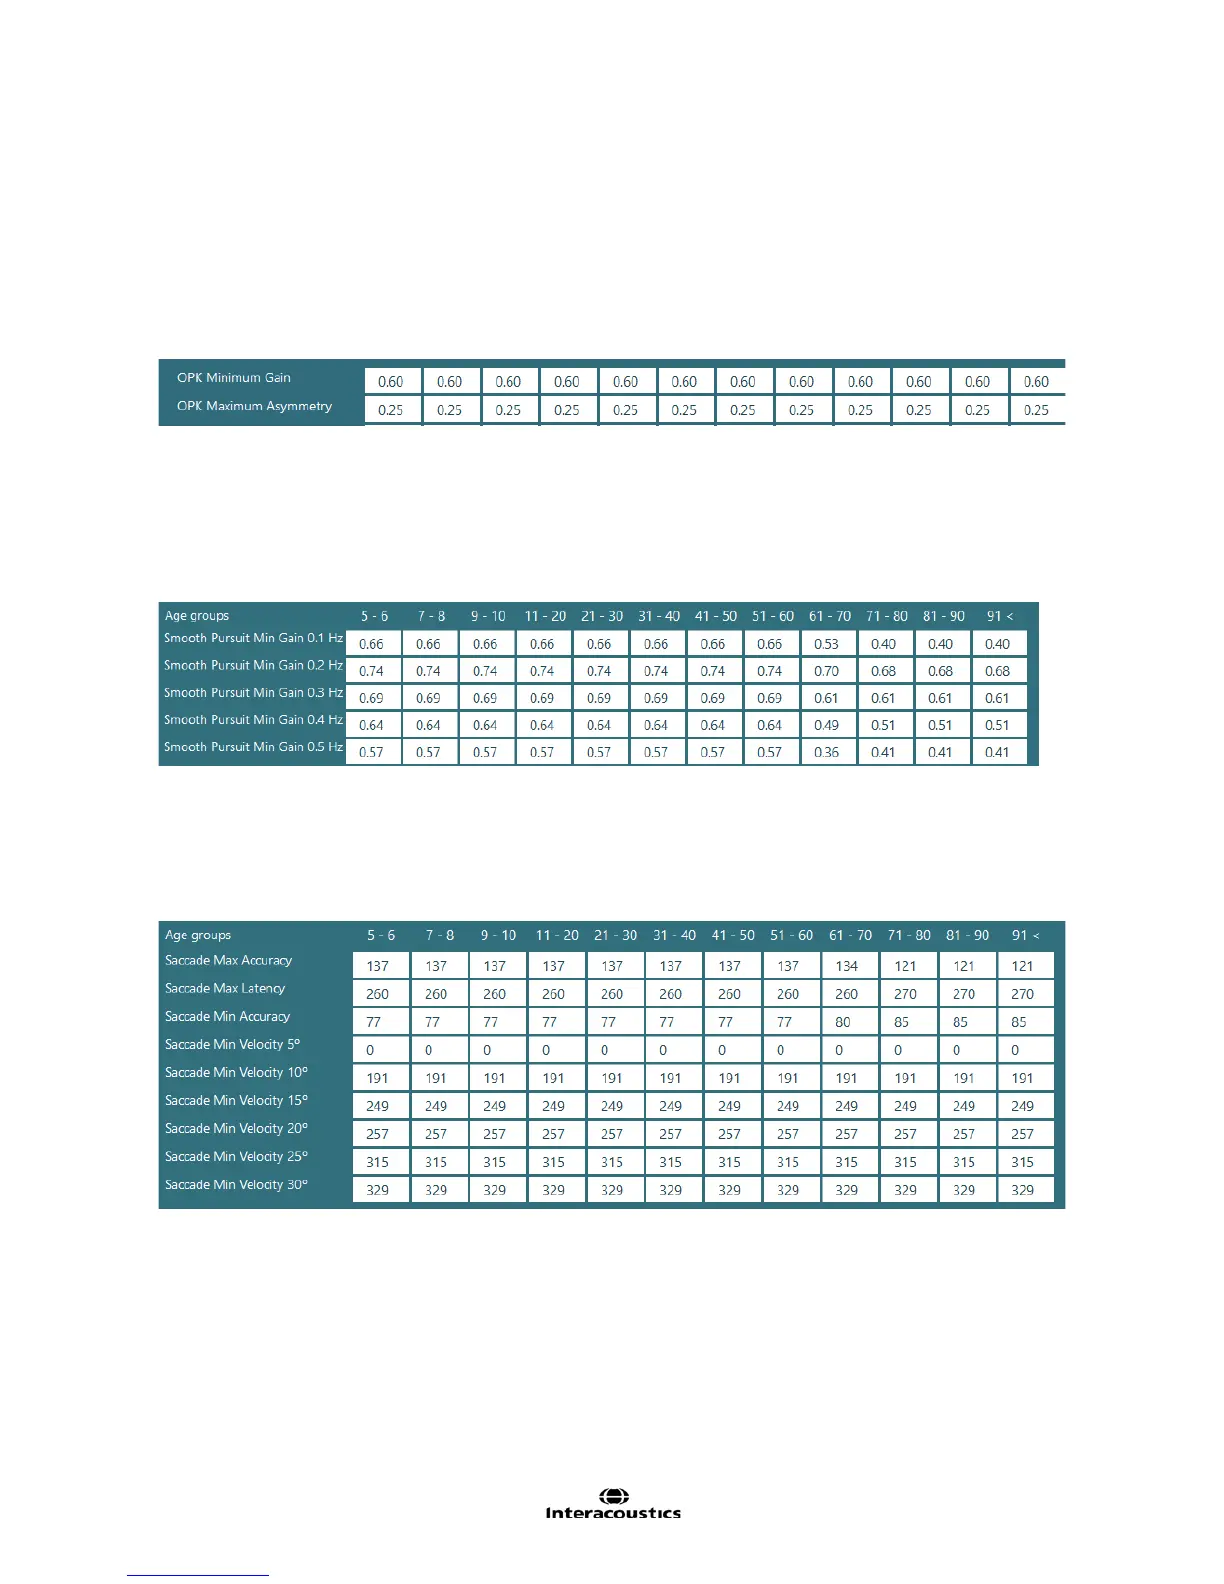
The Optokinetic test measures nystagmus and displays gain and symmetry. The analysis of the optokinetic
test calculates the average velocity of the movement during the peak response window (a.SPV) and
compares this velocity with the projection pattern velocity. The relation of velocity values is called gain (G).
G = a.SPV / Stimulus Velocity
Data acquired in the first three seconds of a measurement is not included in the analysis. The difference
between the 2 ears is the symmetry value.
Figure 9.4.1 Optokinetic threshold values
9.5 Smooth pursuit tests
Gain is measured for each frequency. For each frequency between 0.1 Hz and 0.5 Hz, the average gain
value for all cycles for the selected frequency is compared to the minimum gain value in the table of
thresholds. If the average gain value is less than the minimum gain value specified in the table then the test
will be labeled as outside threshold. Smooth Pursuit threshold data does vary based on the patient’s age.
Figure 9.5.1 Pursuit threshold values
9.6 Saccade tests
Saccade tests measure three values: velocity, latency, and accuracy. Saccade thresholds do vary with
patient age. To create the velocity graph, minimum velocities at velocities between 5 degrees and 30
degrees are used to create a velocity profile.
Figure 9.6.1 Saccade threshold values