VIsualEyes 515/525 - Additional Information Page 17
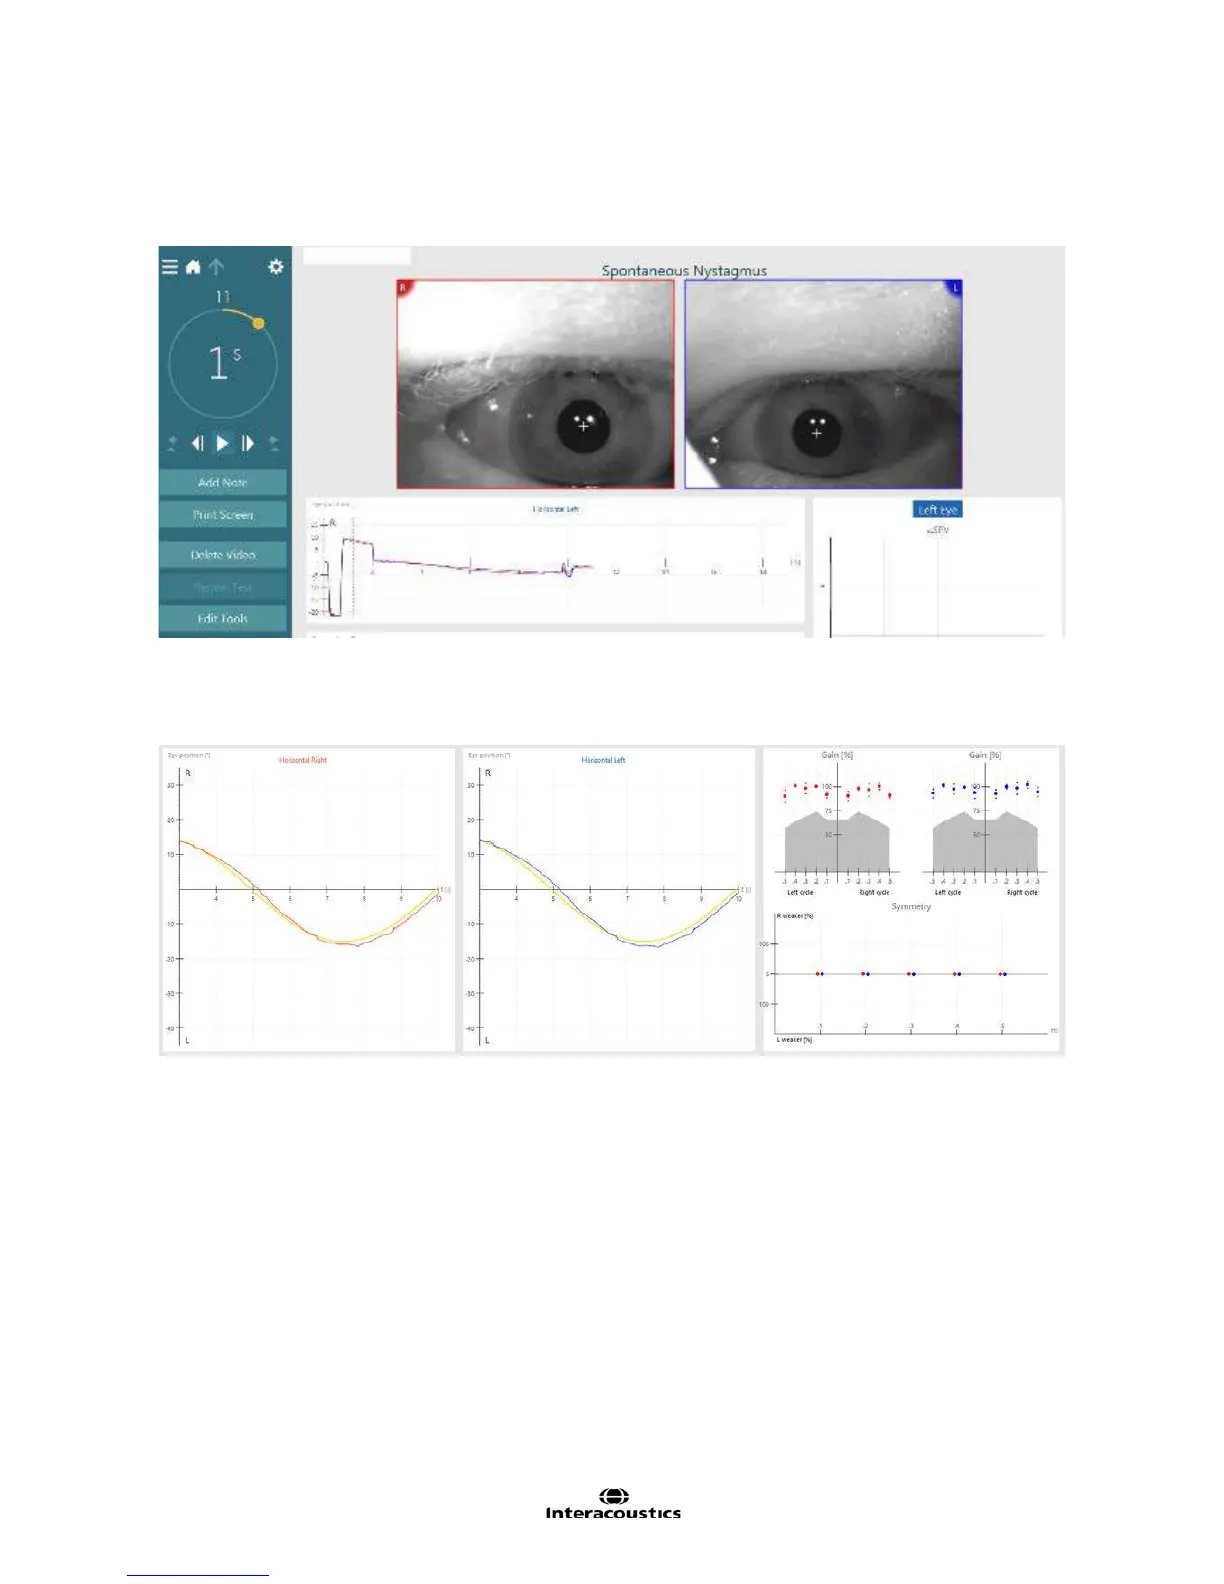
VisualEyes™ VNG offers an easy way to visualize video eye and trace recordings during data collection and
review. The general display shows the eye images in the top portion of the screen and directly below it the
raw tracings for horizontal and vertical channels (Figure 3.1.4). The eye images are presented in real time in
synchrony with raw eye movement traces.
Figure 3.1.4 Test screen
Results are recorded and displayed in a large graphical display that shows the raw data tracing of the eye
movements (Figure 1.35). The right eye movements are recorded in red and the left eye movements are
recorded in blue. The stimulus position is shown in a yellow color.
Figure 3.1.5 Waveform and results display
Both eye/s and raw tracings can be enlarged for easier viewing by double-clicking or double-touching the
item of interest. The graphical area shows time (in seconds) on the horizontal axis and eye and or stimulus
movement (in degrees) on the vertical axis. Direction labels on the graph show the direction of the waveform.