VIsualEyes 515/525 - Additional Information Page 23
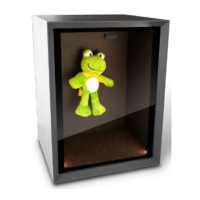
Figure 3.4.2 Smooth Pursuit subtest
The Gain value is given as a percentage value representing the ability of the patient to track the sinusoidal
target without saccadic intrusions (short jumps in the eye position to catch up to the target). Each eye’s gain
is measured for each cycle and displayed on the gain graph as a small dot in either blue (for left eye) or red
(for right eye). A larger dot is displayed on the gain graph representing the average of the eye’s gain at the
selected frequency (e.g. 0.1 Hz). Test thresholds based on age matched patient data studies are displayed
as gray shaded areas and will vary based on the selected frequency. If the average gain value (large dot)
from either eye falls into the shaded area of the gain graph, the software will mark the test as outside
thresholds and use a red diamond.
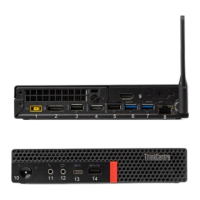
Figure 3.4.3 Gain graph with individual and average gain values
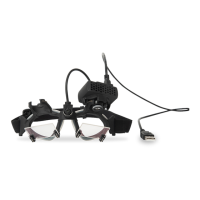
Optionally the Symmetry graph will compare the average left moving gain to the average right moving gain
(up versus down in vertical subtests) and display this result for each eye and each frequency.
Figure 3.4.4 Symmetry graph