VIsualEyes 515/525 - Additional Information Page 45
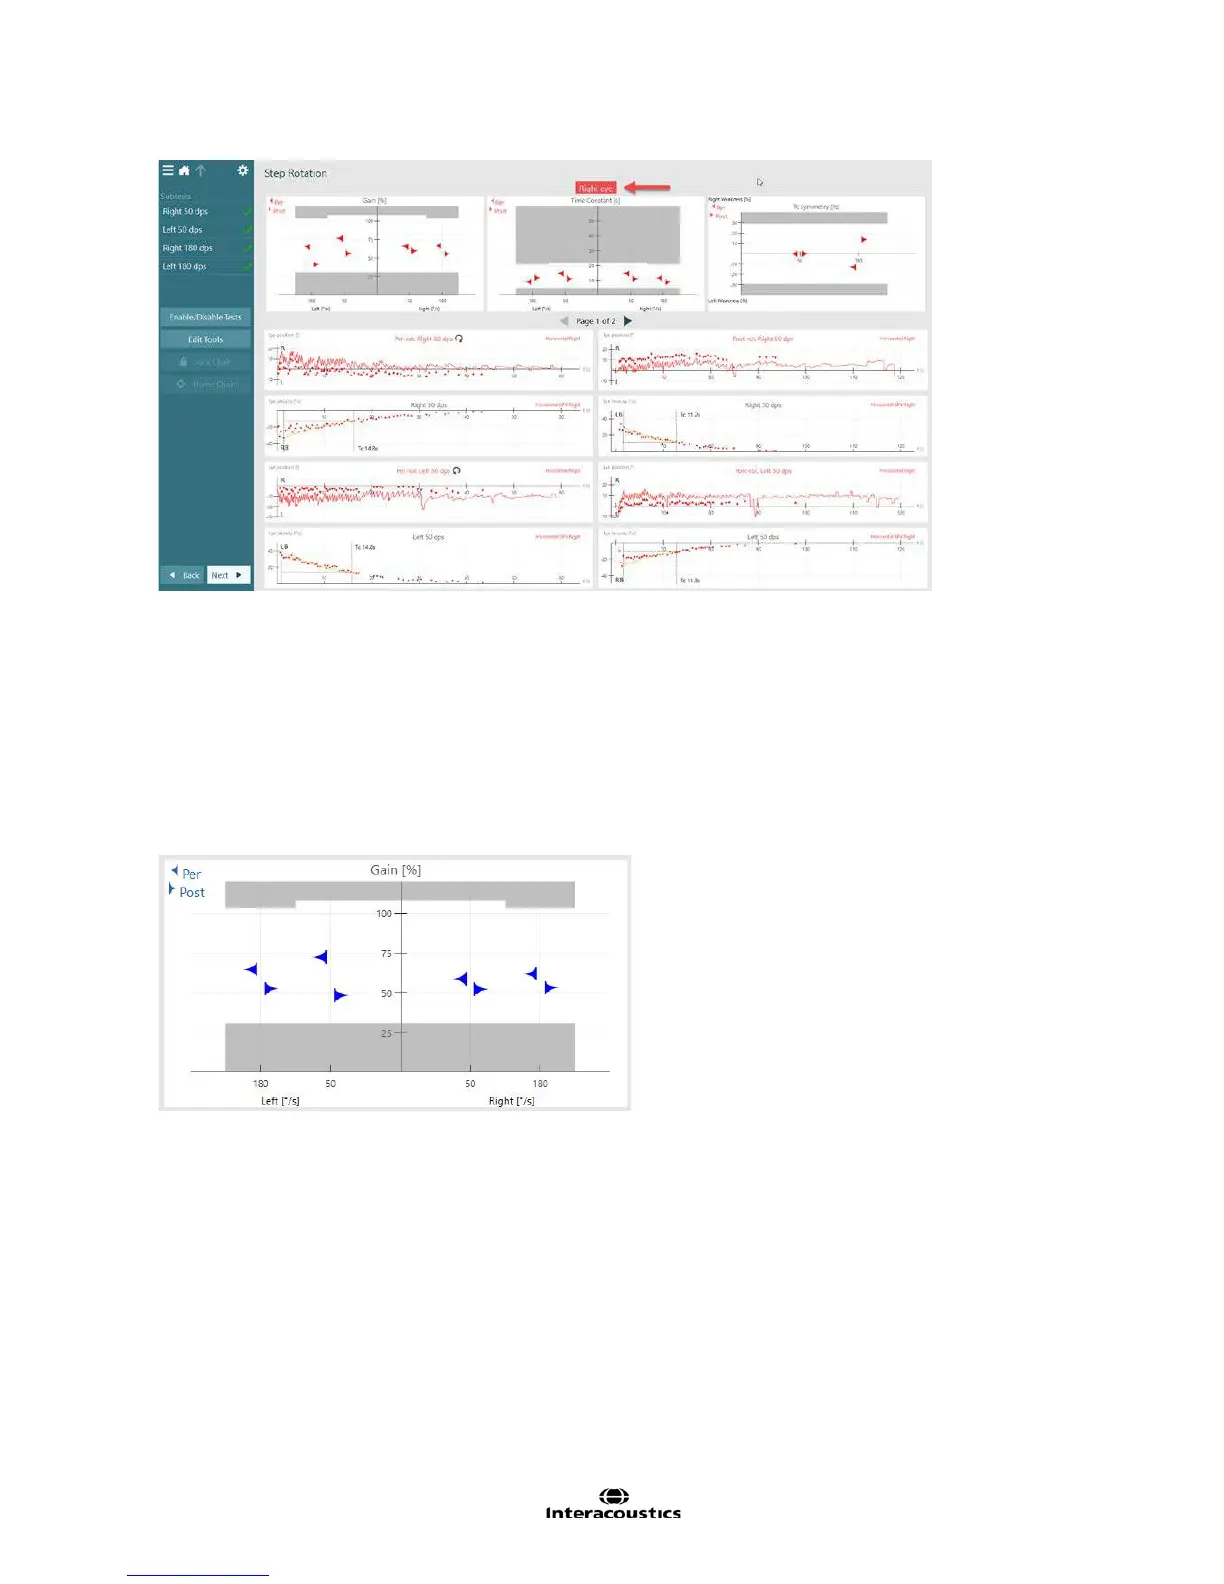
Figure 3.6.21 Right eye results for Step Rotation test
The summary test results screen displays various analyses. The top portion of the summary results screen
displays plots for Gain, Time Constant, and Time Constant Symmetry. These parameters are explained in
detail in the following section.
Gain
Gain is the relation between the patient’s maximum slow phase velocity (SPV) of nystagmus and the
maximum velocity of the rotary chair (stimulus). A total of four gain values will be present for each Step
Rotation speed tested (per-rotary left, post-rotary left, per-rotary right, post-rotary right).
Figure 3.6.22 Gain graph
The gain values are expressed as a percentage (%). Values within the white region of the graph are
considered to be within suggested threshold levels and those in the grey shaded regions are considered to
be outside of the suggested threshold levels or criteria (Figure 3.6.22). When data points fall in the grey
shaded regions, the graph will be marked with a red diamond to indicate that the patient’s data was outside
of the suggested threshold level.