VIsualEyes 515/525 - Additional Information Page 54
To begin the test:
1. Select ‘Start’ from the left menu panel.
2. The timer will begin counting down. The test time is pre-defined by the number of cycles selected for
the test frequency.
The chair will activate and begin moving in a sinusoidal pattern.
Camera recordings will begin at the onset of chair movement.
The target will be displayed on the secondary monitor.
The stimulus and eye movements will be displayed in real time.
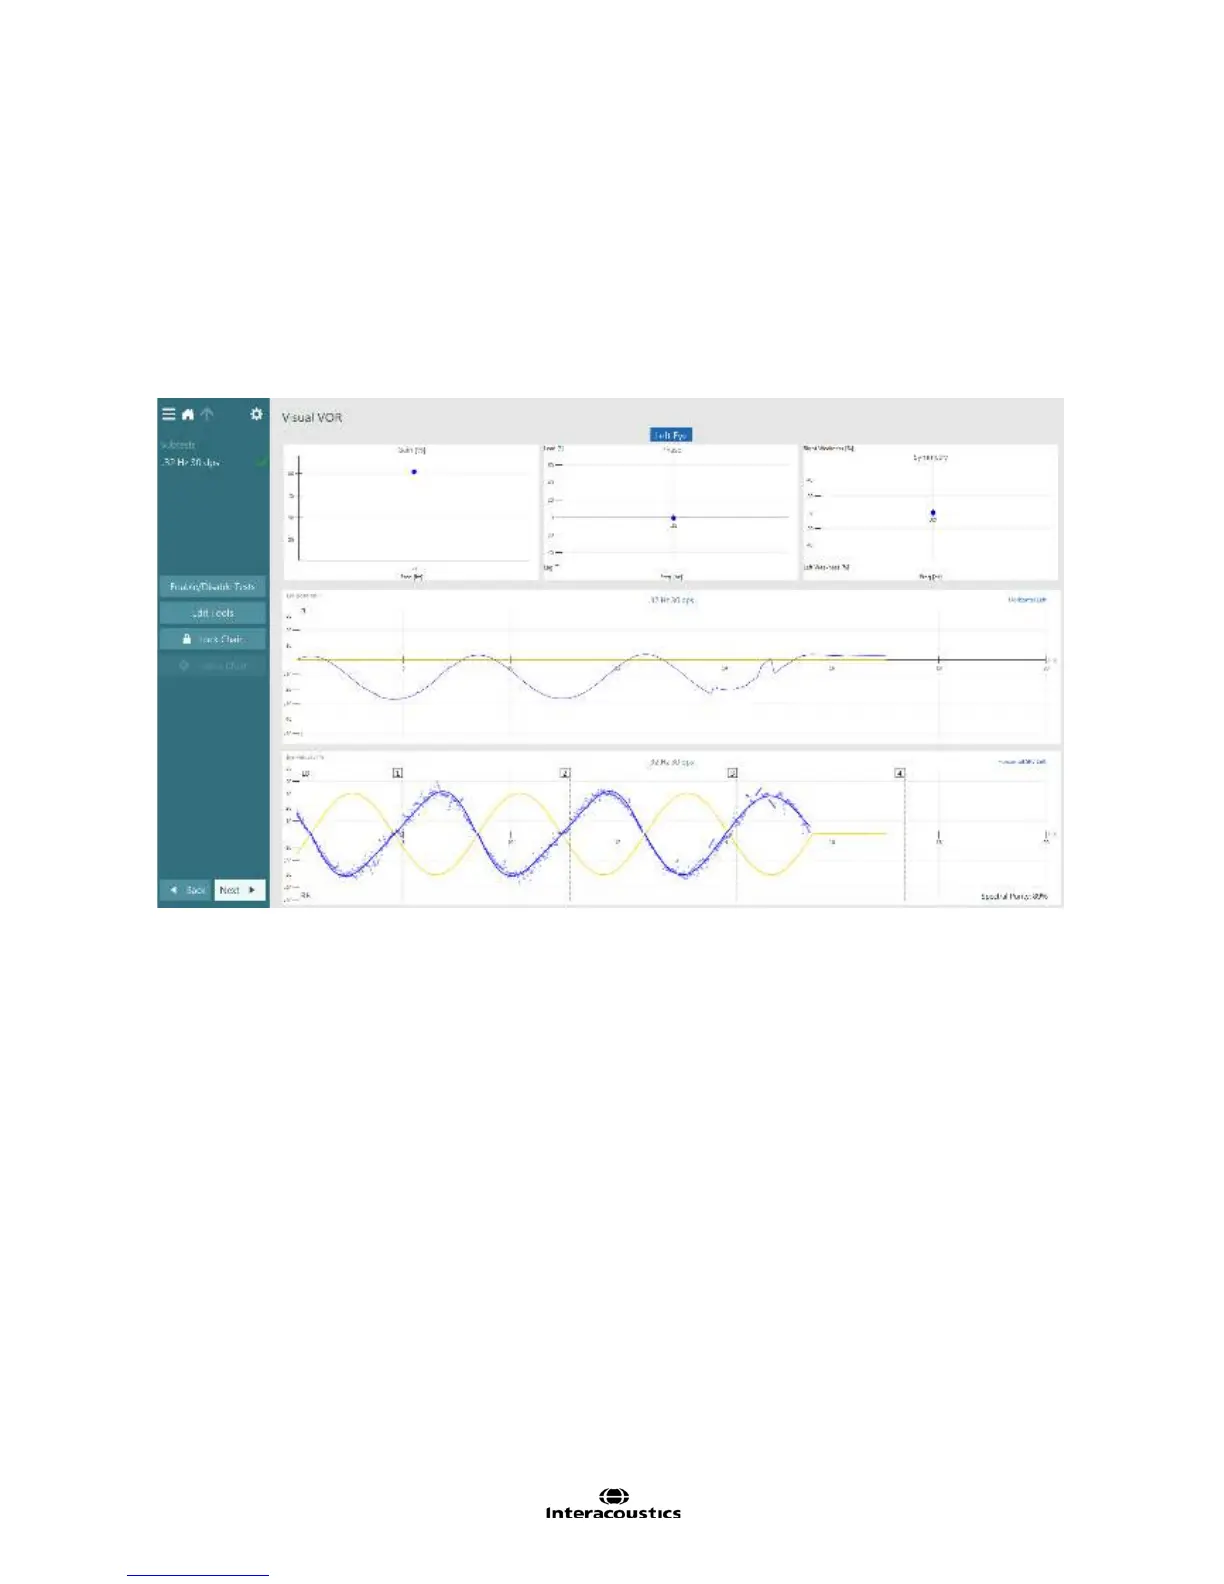
Once the test is complete a summary test results screen will appear (Figure 3.6.39).
Figure 3.6.39 Visual VOR summary
A patient with normal Visual VOR results will produce a tracing that resembles a sinusoid that mirrors the
sinusoid of chair movement. When the VOR is functionally as expected, the patient’s eyes will move equal
and opposite to the chair while he/she is focused on a stationary target. Visual VOR analysis is performed in
a similar manner to SHA in that gain, phase and symmetry are calculated. The data points for each
frequency tested will appear as circles in the graphs.
Please note: The first half cycle (hatched region) of each frequency tested is excluded from analysis
for improved test reliability.
Analysis of eye movements is performed separately for the right and left eyes and the results are displayed
separately. Left eye results are displayed by default. The displayed results can be changed to the right eye
by selecting the eye title in the top center of the summary test results screen.
The summary test results screen displays various analyses. The top portion of the summary results screen
displays plots for Gain, Phase and Symmetry. These parameters are explained in detail in the following
section.