VIsualEyes 515/525 - Additional Information Page 56
Eye position and eye velocity displays
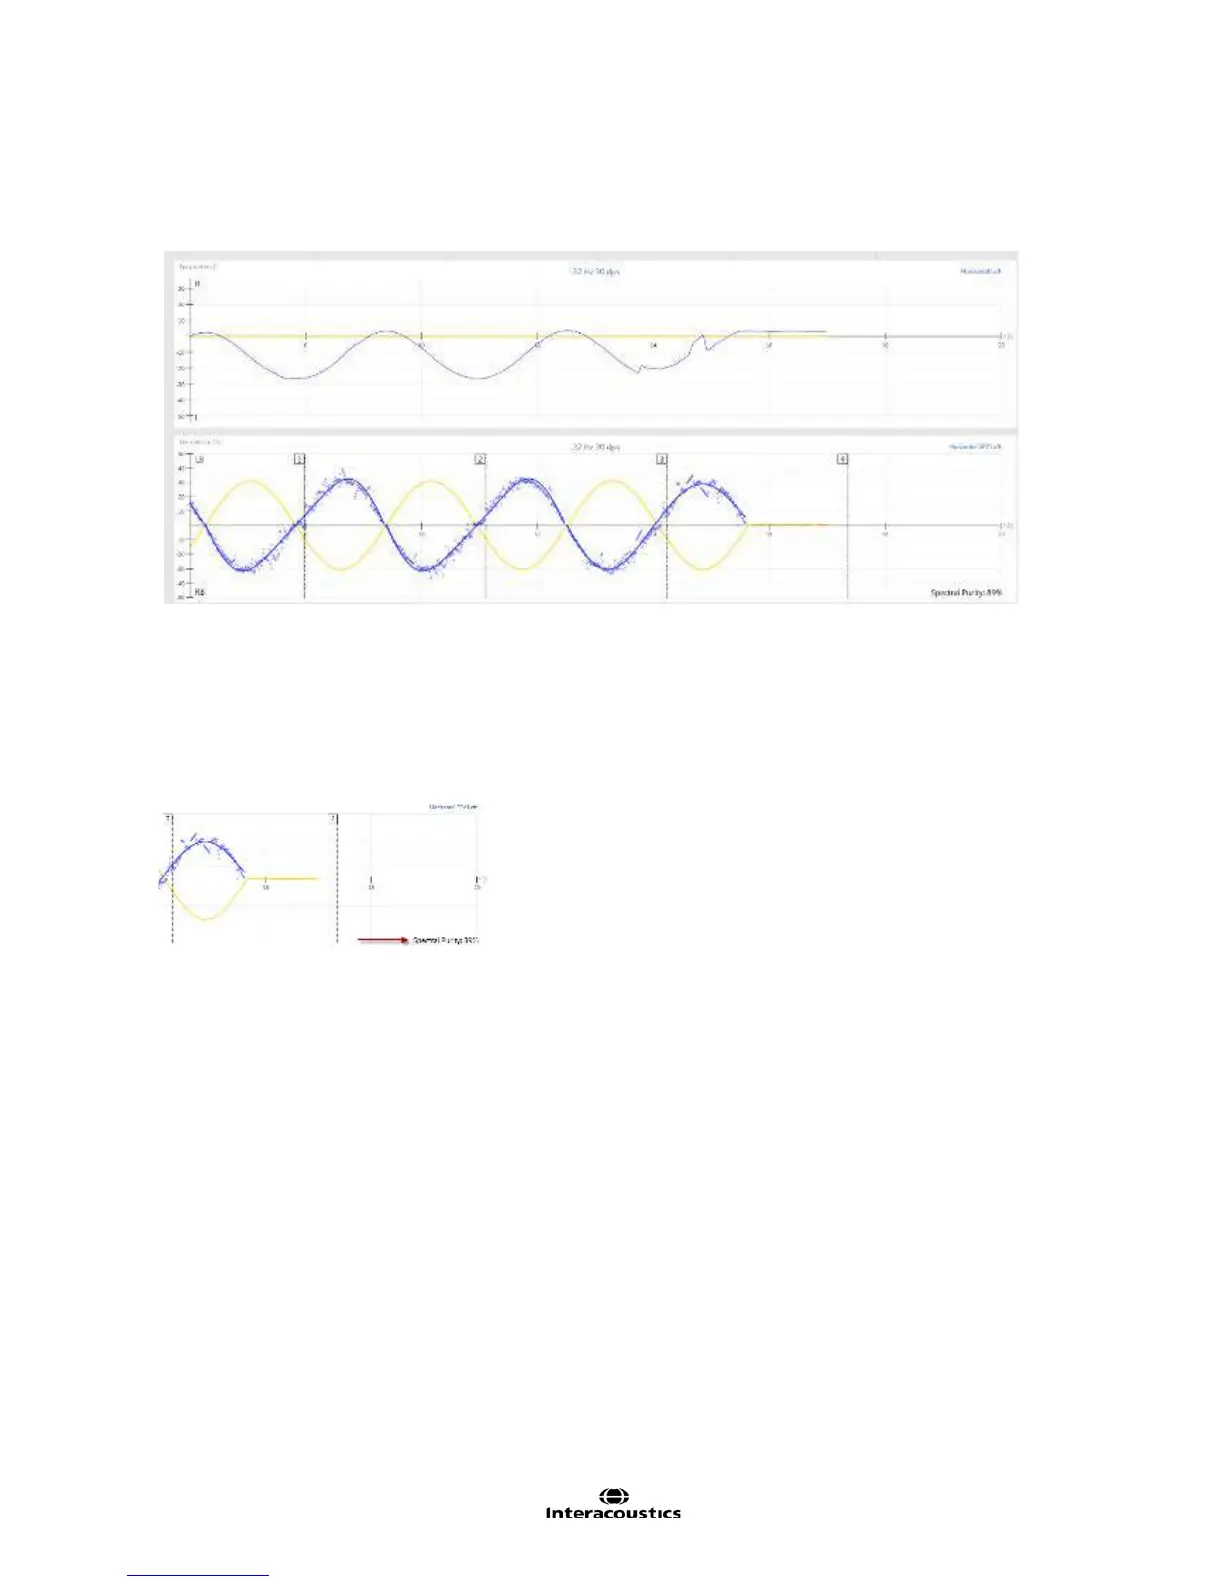
Below the Gain, Phase, and Symmetry graphs are the eye position and eye velocity displays, just as in SHA
and VOR Suppression (Figure 3.6.43). The eye position tracing should resemble a sinusoid. The eye
velocity should appear as a mirror image to chair velocity.
Figure 3.6.43 Visual VOR eye position and eye velocity displays
Spectral purity
A spectral purity value for each frequency tested can be viewed in the lower right corner of the eye velocity
display (Figure 3.6.44). The spectral purity of the evoked nystagmus may be useful to indicate whether the
test values have been influenced by artifact. The higher the spectral purity value, the more reliable the
Visual VOR result. Values are displayed as a percentage (%).
Figure 3.6.44 Spectral purity value