8.
Batch Analysis: Allows you to save and apply the analysis parameters to other images that
you have collected and saved in an image folder (see “Batch analysis” on page94 for more
information).
9.
Exit: Exits the Manual Count tool and displays the Review tab.
10.
Save: Saves the analysis results as an image in the selected
file format (see “Save analysis results”
on page92 for more information).
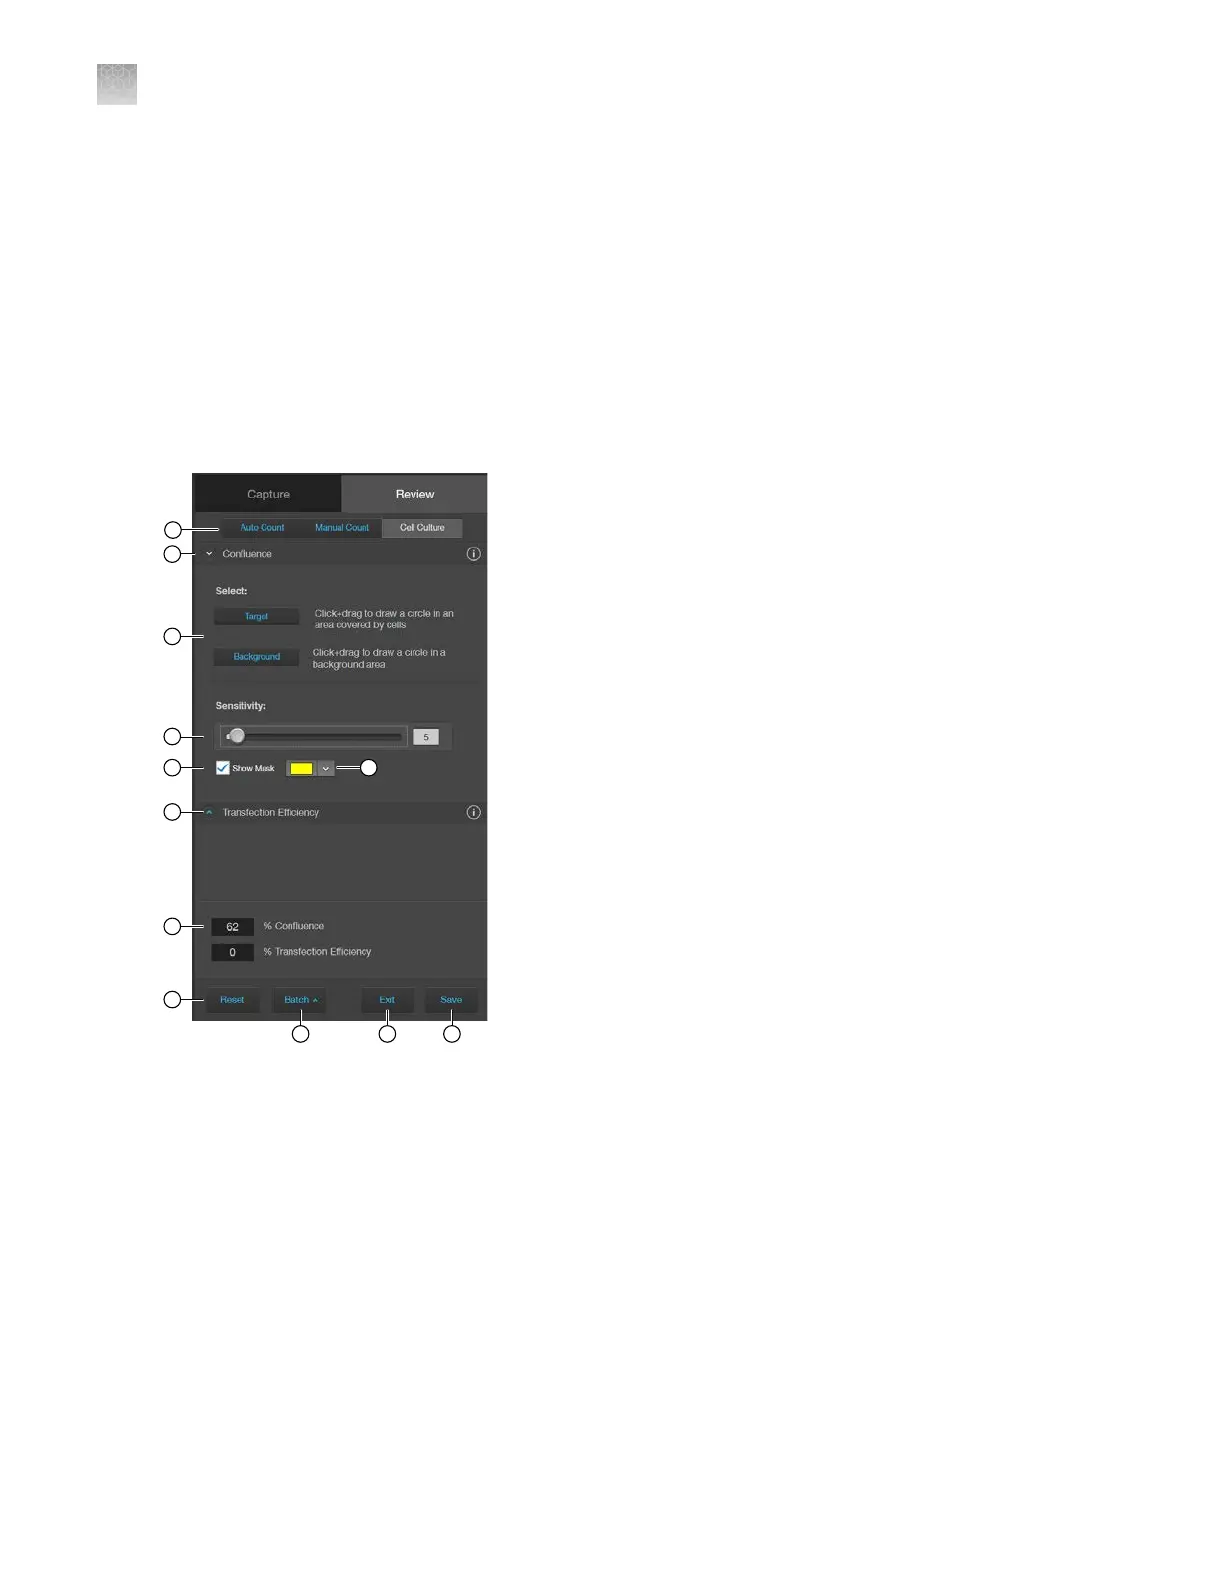
Cell culture – confluence controls
1.
Analysis tools
: Allows you to toggle between Auto Count, Manual Count, or Cell Culture
(Confluence and Transfection Eciency) tools for image analysis.
2.
Confluence
: Expands or hides the controls for the Confluence tool.
3.
Select Target and Background: Allows you to select representative cell and background areas for
the confluence
measurement.
4.
Sensitivity: Adjusts the algorithm sensitivity to pixel intensity (higher intensity = more pixels
included). Decr
easing the sensitivity reduces the confluence value.
5.
Show Mask: Indicates the areas included in the confluence
measurement.
6.
Mask Color: Selects the mask color.
AppendixBGraphical user interface (GUI)
Cell culture – confluence controls
B
130
EVOS
™
M5000 Imaging System User Guide