5.
If the multichannel image was captured in more than two channels, repeat the process for the
other channels until all the channels are correctly aligned.
6.
Click
Save to save the corrected image, then click the Align Channels button to hide the channel
alignment controls.
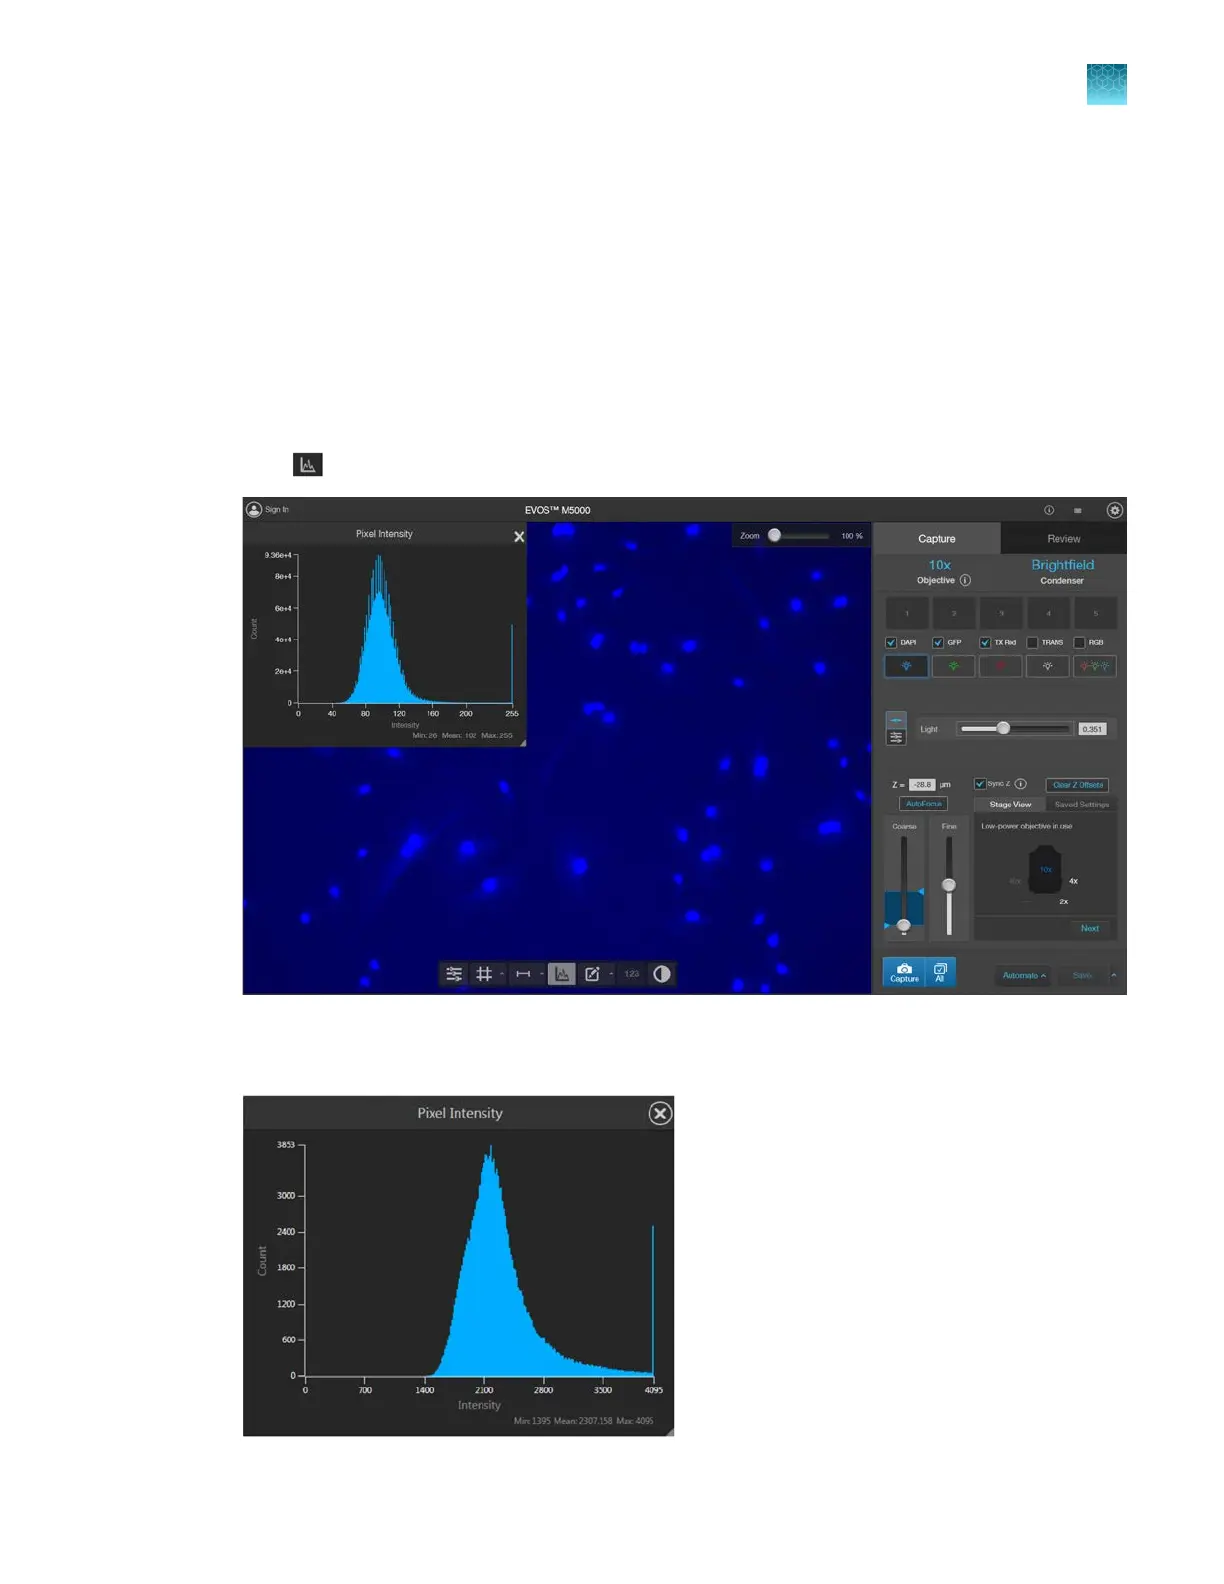
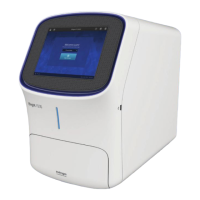
View pixel intensity histogram
Display histogram
1.
Click (Histogram) to open the Intensity Histogram plot.
2.
The Pixel Intensity histogram shows the Pixel count vs. Intensity data of the image displayed in the
Viewing area as well as the minimum, mean, and maximum pixel intensities.
Chapter5Measure, annotate, and analyze captured images
View pixel intensity histogram
5
EVOS
™
M5000 Imaging System User Guide
41