Analyze cell culture
Analysis tools
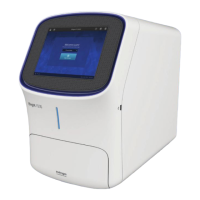
If not already showing, hover the pointer over the Viewing area to reveal the Display Settings and
Analysis Tools toolbar, then click (Show Cell Count) to display Auto Count, Manual Count, and
Cell Culture options in the tabs area.
Note: Display Settings and Analysis Tools is available in both the
Capture and Review tabs.
•
Auto Count
: Automatically counts the objects displayed in the Viewing area based on your
specifications (“Count cells – auto count” on page45). With Auto Count, you can count objects
only in a single fluorescence channel (nuclear stain channel).
•
Manual Count: Allows you to tag objects in the Viewing area with up to six labels. As you tag
objects, the system keeps a running tally of the counts with percentages for each label assigned
(“Count cells – manual count” on page51). With Manual Count, you can count objects in multiple
channels simultaneously.
•
Cell Culture: Allows you to measure the confluence of your culture and calculate the transfection
eciency.
–
Confluence: Allows you to select up to five reference objects for the target (for example, cells)
and one background reference in your image, then automatically calculates the percentage of
confluence of your culture (“Count cells – manual count” on page51).
–
Transfection Eciency: Allows you to estimate the transfection eciency of your culture by
calculating the ratio of fluorescence area (i.e., cells expressing the fluorescence marker) to the
total cell area in your culture (“Calculate transfection eciency” on page58).
•
Batch Analysis: Allows you to save and apply the analysis parameters set in the Auto Count,
Confluence, and Transfection Eciency tools to other images that you have collected and saved
an image folder (“Batch analysis” on page94). Batch Analysis is not available for Manual Count.
IMPORTANT! For analysis, only use 16-bit image files
(TIFF or PNG). The 16-bit images of individual
channels contain the full dynamic range and metadata needed for quantitative analysis, whereas display
image files do not.
Chapter5Measure, annotate, and analyze captured images
Analyze cell culture
5
44
EVOS
™
M5000 Imaging System User Guide