3.
To move the histogram, click within the plot heading area and drag the plot to the desired location.
4.
To resize the histogram, click the grey triangle at the lower right corner of the plot, then drag the
plot t
o the desired size.
5.
Click the
Histogram button again to close the Pixel Intensity histogram.
Alternatively, click the X on the plot window to close the histogram.
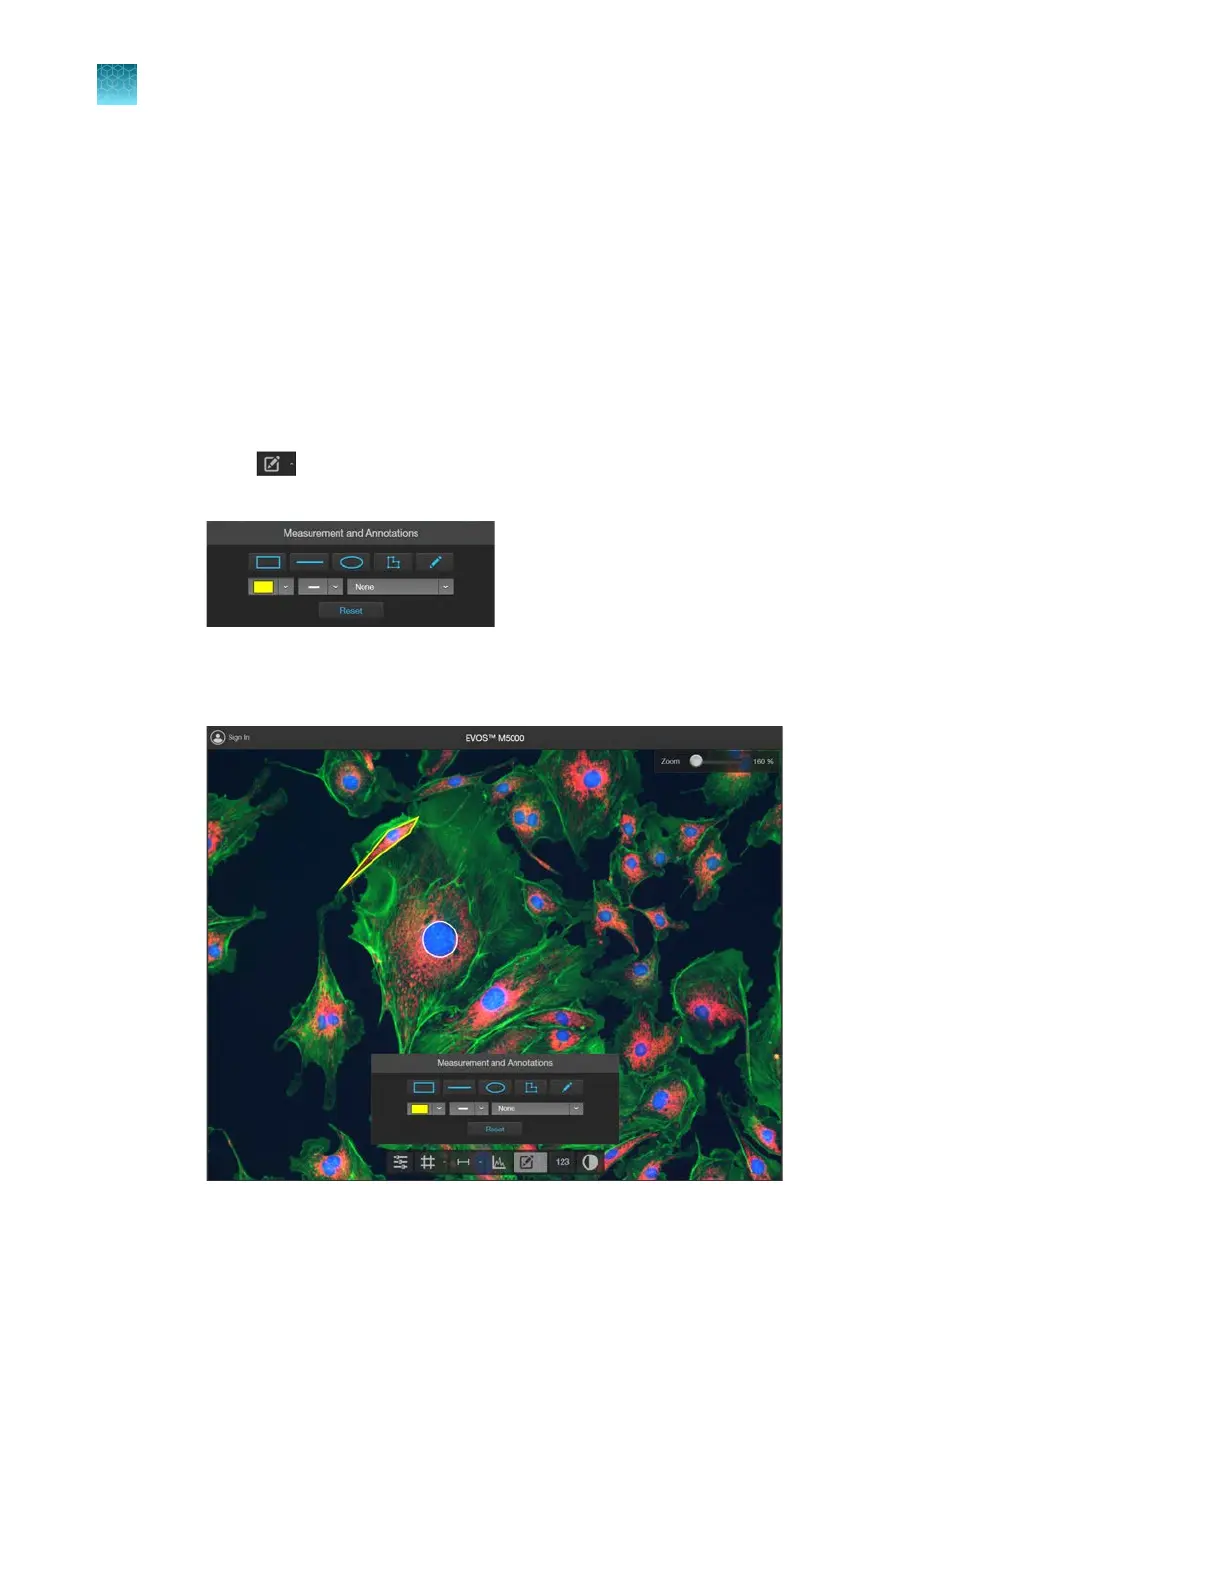
Add measurements and annotations
1.
Click (Measurement and Annotations) (the arrow on the Show Measurements and
Annotations split button) to open the measurement and annotations tools.
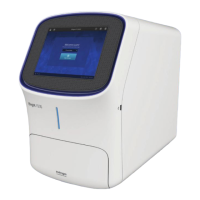
2.
Using the
Annotations tools, draw a rectangle, line, ellipse, polygon, or a free-form shape over
the region of interest on the Viewing area. You can draw multiple shapes of dierent types.
3.
If needed, change the Color
and Thickness of the annotation to make it more visible over the
image.
Chapter5Measure, annotate, and analyze captured images
Add measurements and annotations
5
42
EVOS
™
M5000 Imaging System User Guide